
Search Exchange
Search All Sites
Nagios Live Webinars
Let our experts show you how Nagios can help your organization.Login
 New Listings
Directory Tree
Directory
Search Results
The search results below show both sub-categories and individual listings that match your search criteria.
Meet The New Nagios Core Services Platform
Built on over 25 years of monitoring experience, the Nagios Core Services Platform provides insightful monitoring dashboards, time-saving monitoring wizards, and unmatched ease of use. Use it for free indefinitely.
Monitoring Made Magically Better
- Nagios Core on Overdrive
- Powerful Monitoring Dashboards
- Time-Saving Configuration Wizards
- Open Source Powered Monitoring On Steroids
- And So Much More!
Submit Your Nagios Project!
Help build Nagios Exchange for yourself and the entire the Nagios Community by your Nagios project to the site. It's easy - just create an account, login, and add a new listing. Read the FAQ for instructions.Ping Action
![]() This component adds an action to host and service detail screens that allows you to quickly ping the host or device. Useful for troubleshooting network connectivity.
This component adds an action to host and service detail screens that allows you to quickly ping the host or device. Useful for troubleshooting network connectivity.
PHP Nagios Traceroute and Ping
Want to View Ping & Traceroute results from your web browser, then this is the php script for you ! ;-)
PerfParse
 PerfParse facilitates the storage and analysis of binary performance data produced by Nagios and produces high-quality accurate graphs of live data from standard Nagios plugins. A permanent history of plugin results can then be viewed with advanced analys ...
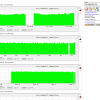
Performance History Graphs for Nagios with Nagiosgraph
Nagiosgraph is our most important extension to the monitoring system. There are several packages available for Nagios graphing, but at the time of implementation in 2008 the Nagiosgraph package was a lucky choice. Today we have more then 3740 service grap ...
Performance Data Tool
 The purpose of the Performance Data Tool is to give you the ability to view and manipulate the .rrd and .xml performance data files on your Nagios XI host. This can be helpful for: * Viewing graphs for services that have been disabled ** Because they are ...
Peplink Balance Status
Check the status of a Peplink Balance device running firmware 5.4.x with SSH enabled.
PDFReport
Creates a PDF or HTML summary report showing the availability over the last month for a specified hostgroup's members and their services. By Steve Shipway.
Passive Check Nagios XI Wizard
![]() This Nagios XI wizard allows you to easily configure passive services that should be monitored. Passive services are ideal for monitoring event log data, security alerts, and other asynchronous event/alert data.
This Nagios XI wizard allows you to easily configure passive services that should be monitored. Passive services are ideal for monitoring event log data, security alerts, and other asynchronous event/alert data.
Parameter Driven Generic Event Handler
This is a generic use, parameter driven event handler script. It allows for simple command definitions to run event handlers under various conditions. Use this to restart Windows/Linux/Unix services remotely (ie without having to install any software ...
PAPOUCH Thermometer plugin
 Nagios plugin for checking environmental temperature with PAPOUCH ethernet thermometer.
PagerDuty
Phone & SMS alerting service for Nagios and all your other monitoring tools.
Packeteer - Check Packetshaper - SNMP v1, v2c, v3
Check Packeteer Packetshaper - Version 2.0 (29/12/2009) > Device's informations > Partitions size (min and max) > Specific class
OzekiMonitor
Monitor status of ozeki sms gateway service by snmp query
OverHTTP 0.15
OverHTTP is a Nagios plugin that provides a way to check services remotely over the HTTP protocol. The plugin is developed by Douglas Christopher Wilson.
Osesm
Osesm is a GTK+ frontend for Nagios. Osesm provides configuration wizards and drag and drop support.
Oracle Plugin Install
This document describes how to install Oracle plugins in Nagios XI and how to configure your environment to utilize the Oracle plugins to monitor Oracle databases with Nagios XI. This document is intended for use by Nagios XI Administrators who wish to ...
opsgenie_heartbeat_checker
 How do you monitor Nagios to ensure it's operational? Using this plugin, Nagios sends periodic heartbeat messages to OpsGenie service, and if OpsGenie does not receive heartbeat messages for a configurable time period, appropriate people can be notified v ...
OpsGenie
 OpsGenie is a cloud-based service for dev & ops teams, providing reliable alerts notifications through multiple channels (email, SMS, phone calls, iOS & Android push notifications, group chat etc.), on-call schedule management and escalations. OpsGenie in ...
OpenVPN connnected users
Check for connected users via SNMPD on the OpenVPN host. No need to enable the OpenVPN management and/or introduce new checks on the Nagios server.
OpenSIPs memory check
Plugis checks memory usage (both Shared and Private memory allocation) of OpenSIPs SIP server via XML RPC module.


