Search Exchange
Search All Sites
Nagios Live Webinars
Let our experts show you how Nagios can help your organization.Login
Directory Tree
Directory
Recently Updated Listings
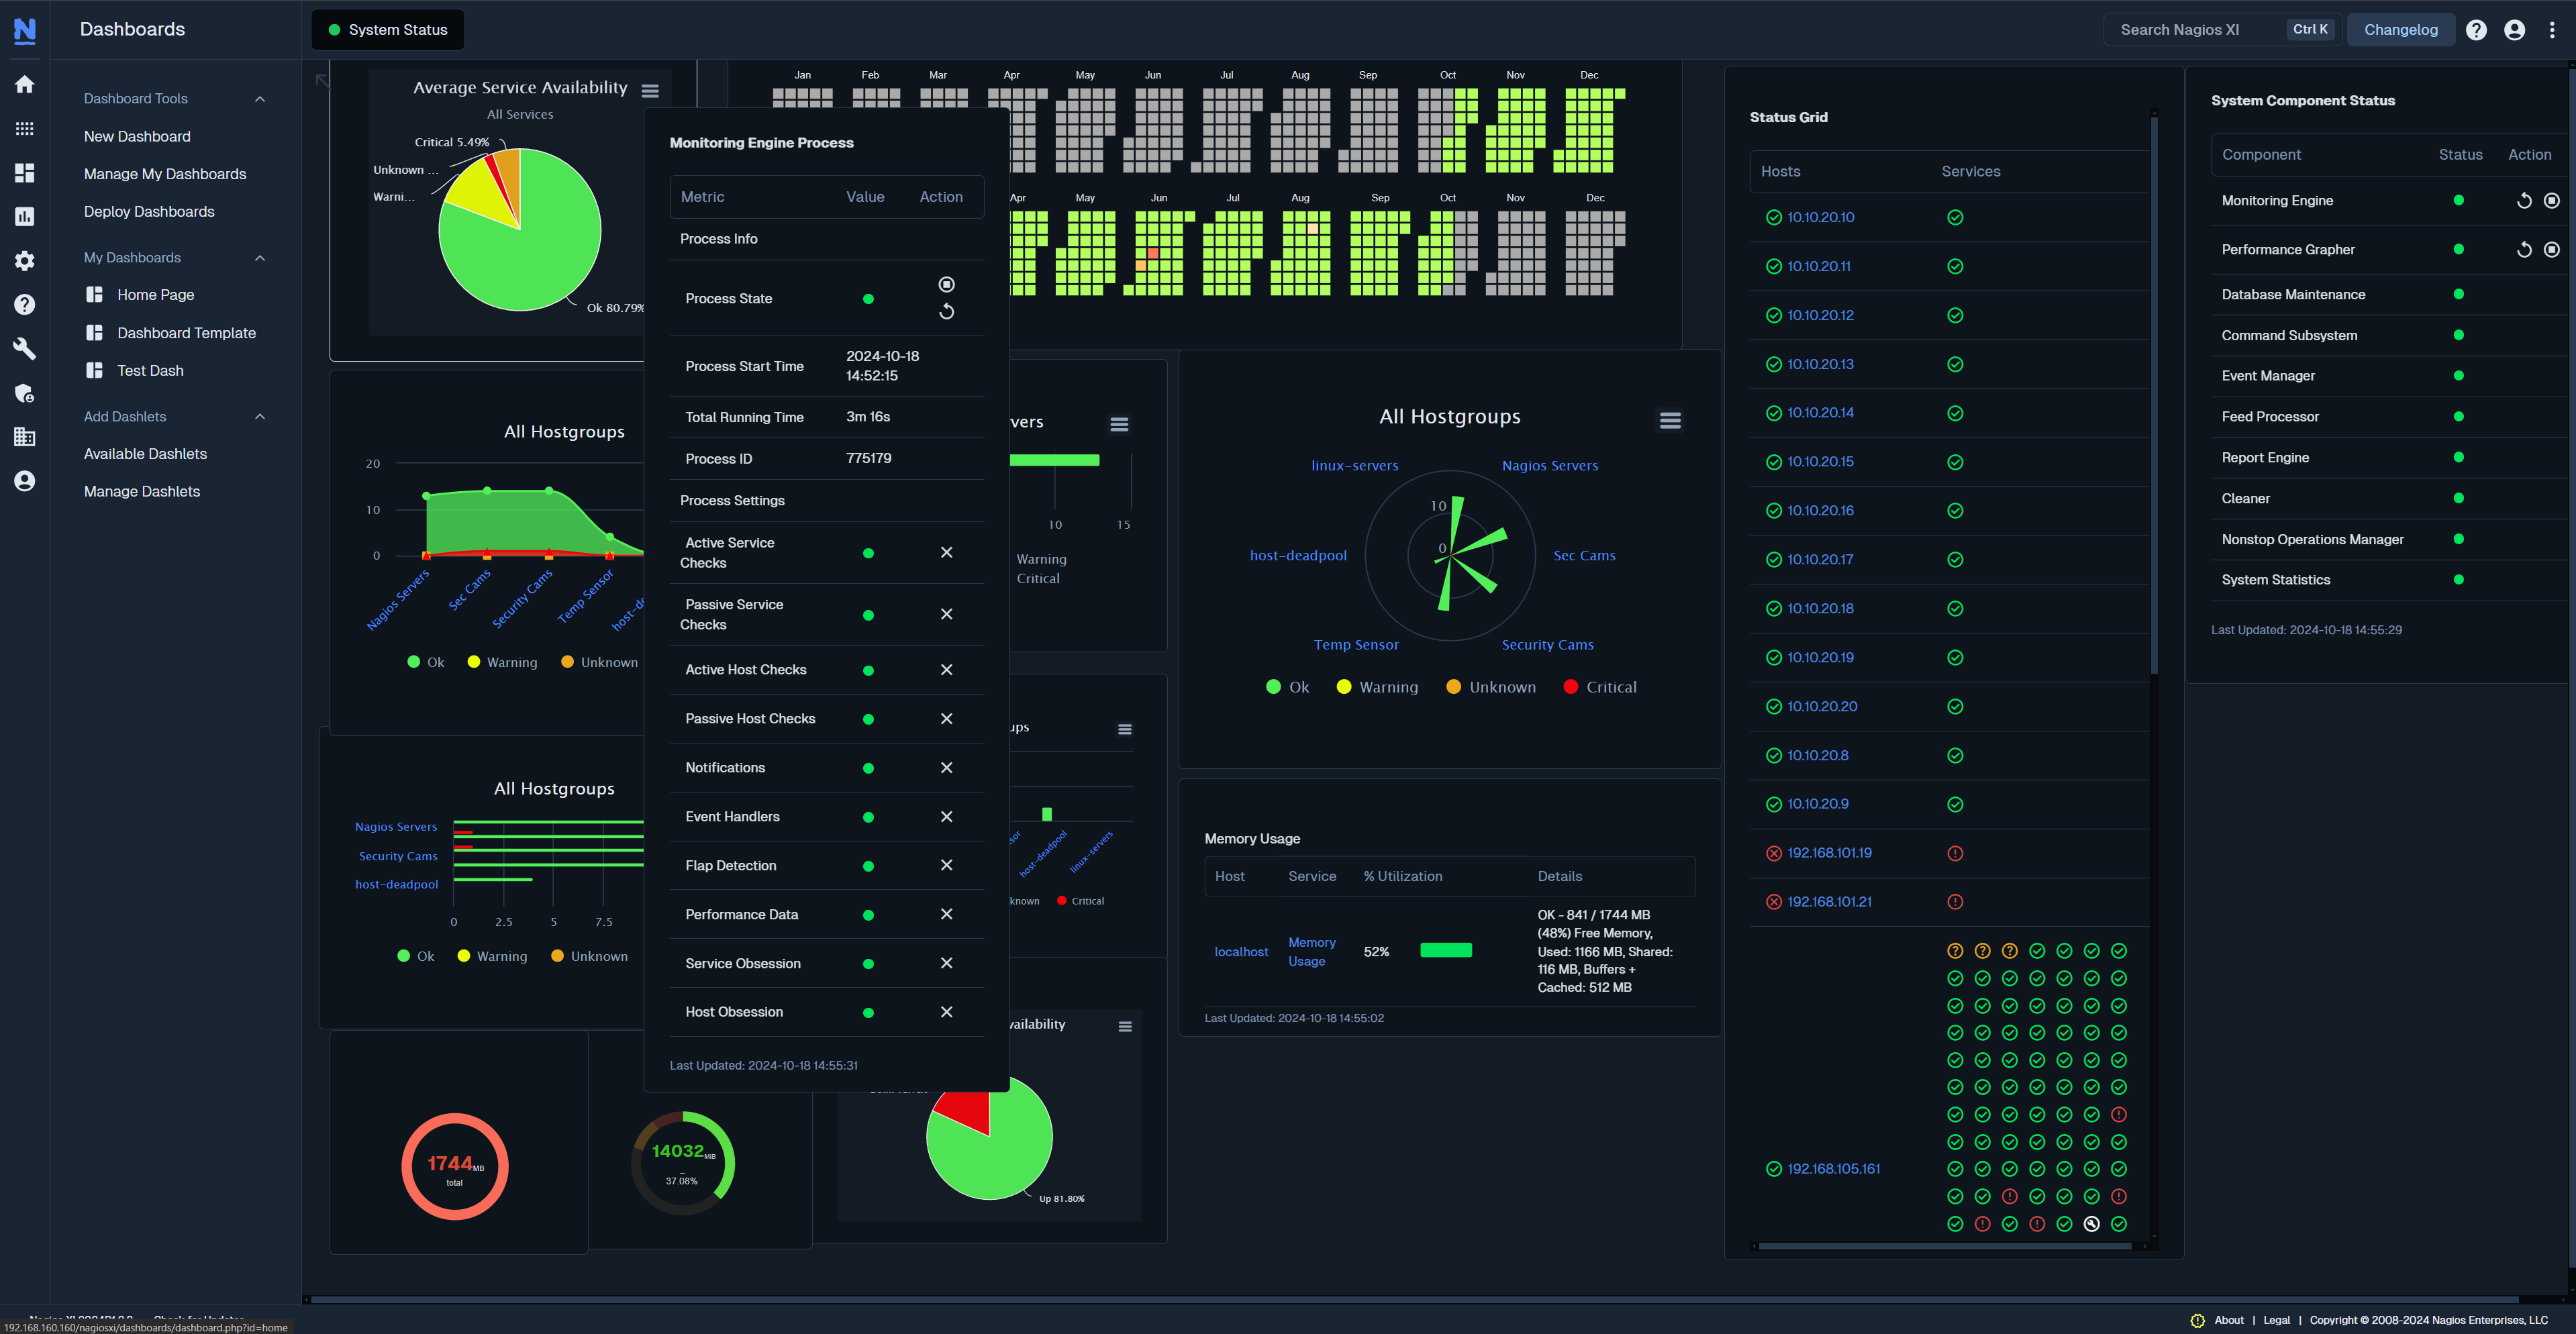
Meet The New Nagios Core Services Platform
Built on over 25 years of monitoring experience, the Nagios Core Services Platform provides insightful monitoring dashboards, time-saving monitoring wizards, and unmatched ease of use. Use it for free indefinitely.
Monitoring Made Magically Better
- Nagios Core on Overdrive
- Powerful Monitoring Dashboards
- Time-Saving Configuration Wizards
- Open Source Powered Monitoring On Steroids
- And So Much More!
Submit Your Nagios Project!
Help build Nagios Exchange for yourself and the entire the Nagios Community by your Nagios project to the site. It's easy - just create an account, login, and add a new listing. Read the FAQ for instructions.Monitor Palo Alto HA synchronization via REST API
 Monitoring Palo Alto HA synchronization is a key step in ensuring the reliability, consistency, and security of your network infrastructure. Using the REST API and the Palo Alto API key, you can automate this monitoring with a dedicated Perl script design ...
check_pacman
Small bash script to monitor upgradeable packages using pacman.
Check email round trip
Plugin to monitor email round trips
check_o365health
check o365 service health using microsoft.graph
Nagios CPU mpstat Plugin
Enhanced CPU Utilization Check using mpstat, with support for user/system/iowait thresholds. Based on the original check_cpu.sh script by Andreas Baess.
FreeBSD and Solaris network bandwidth
This is a plugin that returns performance values for network bandwidth on FreeBSD hosts using netstat command. With version 1.1, the plugin is now compatible with Solaris/illumos hosts using nicstat command.
Monitor Quantum Scalar i3 Tape Libraries via SNMPv3
A clean, production-ready Nagios plugin to check the overall health and operational state of Quantum Scalar i3 tape libraries using SNMPv3 (authNoPriv). The script evaluates and decodes the statuses of key subsystems — including library health, RAS, dri ...
CheckTeamviewerVersion
This is a Nagios plugin that monitors the version of Teamviewer installed on a Windows system, using PowerShell, and lets you know if it is out of date or not. It fetches the most recent version of Teamviewer by checking their website. Full documentation: ...
CheckForRestartsAndUptime
This is a Nagios plugin that uses PowerShell to check Windows machines for recent reboot events and their current uptime. Full documentation: https://github.com/sawft99/NagiosPlugins
CheckNCPAVersion
This is a Nagios plugin that monitors the version of NCPA installed on a Windows system, using PowerShell, and lets you know if it is out of date or not. It fetches the most recent version of NCPA by checking their GitHub page. Full documentation: https:/ ...
CheckPSSignatures
This is a Nagios plugin that checks if any PowerShell scripts in the plugin folder have a soon to expire, expired, invalid, or non-existent signature. Full documentation: https://github.com/sawft99/NagiosPlugins
check_x224 Featured Popular
Checks that the most basic parts of a Remote Desktop connection succeeds.
minimalistic check_disk.sh
Another but minimalistic disk check/status plugin. This script will show only local file-systems, local partitions are sorted from the most in use (as occupancy).
check_mysqlrouter.sh
 Simple but effective script shell to monitor mysql-router service status.
check_innodbcluster.sh
 Simple but effective script shell (dash) to check InnoDB Cluster's node status (requires netcat package).
Check Netbackup Media Volume Pool Size
 Simple shell script to check how many tapes are in media volume pool. You may set thresholds to have warning and critical notifications.
check_hostgroup
This Nagios plugin provides precise monitoring by checking the percentage of hosts in a DOWN state within a hostgroup.
check_db2_health
 check_db2_health is a plugin which checks the most common metrics of a DB2 database.
$ check_db2_health
Please select a mode
Copyright (c) Gerhard Lausser
Check various parameters of DB2 databases
Usage:
check_db2_health [-v] [-t ] ...
check_hp Popular
Check CPUs, fans, array controllers, logical / physical drives, temperature and power supplies on your Proliant servers or blade systems through SNMP. As of version 2.20 you can use this plugin to retrieve performance data for Smart Array CPUs.
NetMap4Nagios
 Create your own network diagram of live monitoring hosts and services. NetMap4Nagios is a visualization addon for Nagios and front-end for system Nagios. It is easy to use. You can import hostgroups and servicegroups from Nagios, create customer map of ne ...

 Directory
 New Listings