
Search Exchange
Search All Sites
Nagios Live Webinars
Let our experts show you how Nagios can help your organization.Login
 New Listings
Directory Tree
Directory
Search Results
The search results below show both sub-categories and individual listings that match your search criteria.
Meet The New Nagios Core Services Platform
Built on over 25 years of monitoring experience, the Nagios Core Services Platform provides insightful monitoring dashboards, time-saving monitoring wizards, and unmatched ease of use. Use it for free indefinitely.
Monitoring Made Magically Better
- Nagios Core on Overdrive
- Powerful Monitoring Dashboards
- Time-Saving Configuration Wizards
- Open Source Powered Monitoring On Steroids
- And So Much More!
Submit Your Nagios Project!
Help build Nagios Exchange for yourself and the entire the Nagios Community by your Nagios project to the site. It's easy - just create an account, login, and add a new listing. Read the FAQ for instructions.Plotly4Nagios
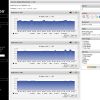
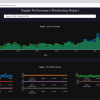 Plotly4Nagios is a nagios plugin to display the performance data in Graph. It uses the RRD database provided by pnp4nagios and visualize it in interactive graph format using plotly javascript framework.
Perl SNMP Printer check
Based upon a shell script that does snmp printer checks (see http://exchange.nagios.org/directory/Plugins/Hardware/Printers/SNMP-Printer-Check/details), I decided the performance would much better if it was written in perl. So I converted the script to pe ...
Perl check radius with performance data like check_radi...
Fork of "Perl check radius" plugin that also outputs performance data in the format of check_radius_adv. Please see the original plugin for system requirements and instructions.
PerfParse
 PerfParse facilitates the storage and analysis of binary performance data produced by Nagios and produces high-quality accurate graphs of live data from standard Nagios plugins. A permanent history of plugin results can then be viewed with advanced analys ...
Performance History Graphs for Nagios with Nagiosgraph
Nagiosgraph is our most important extension to the monitoring system. There are several packages available for Nagios graphing, but at the time of implementation in 2008 the Nagiosgraph package was a lucky choice. Today we have more then 3740 service grap ...
Performance Graphs for Nagios with nagiosgraph
 Performance History Graphs for Nagios with nagiosgraph
Performance Data Tool
 The purpose of the Performance Data Tool is to give you the ability to view and manipulate the .rrd and .xml performance data files on your Nagios XI host. This can be helpful for: * Viewing graphs for services that have been disabled ** Because they are ...
perf2rrd
perf2rrd is a Java utility that will automate the extraction of performance data from Nagios plugins into round robin database files (.rrd's).
Patch to increase performance of Nagios CGIs - Nagios 2...
This patch increase performance of Nagios CGIs.
Palo Alto Firewall VPN Information Global Protect PanGP
This is a simple script to get information about connected vpn users and utilization of possible vpn channels. Output with performance graph. Usage: check_paloaltovpn warning and critical are for utilization check only
Palo Alto Firewall
SNMP Check for Palo Alto Firewalls with Performance data Tested on PA 3020 there is another file for PA 500 because fanspeed is not availible. Only Fanstatus.
opdb
The opdb project is a nagios broker that writes statistics and performance data to a mysql database.
nsca_fast
Faster, high-performance NSCA server with worker and threadpool support. Drop-in replacement.
nrpe plugin: check_meminfo.pl
Plugin to get info from /proc/meminfo. This plugin lets you get any info from meminfo, including anything that may be architecture specific or added in the future. As well as getting performance data, you can also set warning and critical thresholds t ...
nrpe plugin: check_lsf_host.sh
 Plugin for nagios nrpe to report on local host lsf status and performance data. Uses bhosts and lsload lsf commands. Performance data tested with pnp4nagios, which produces a time graph for each metrix in the lsloads listing.
Why is this run on the loc ...
Plugin for nagios nrpe to report on local host lsf status and performance data. Uses bhosts and lsload lsf commands. Performance data tested with pnp4nagios, which produces a time graph for each metrix in the lsloads listing.
Why is this run on the loc ...
Nimble Storage Hardware Pool Disk Space API Check Scrip...
The script utilises the Nimble Storage API to provide some basic disk space usage monitoring. Although the Nimble Storage alerting system via Infosight is very good, we all know the warm fuzzy feeling of seeing a nice green service status in NagiosXI. The ...
Nicholas Scott - Nagios Performance Tuning
This presentation covers methods for monitoring and improving the performance of your Nagios servers - including use of caching, RAM disks, passive checks, and database optimization.
Newtest2Nagios
![]() Newtest is a unique source of information when it comes to performance analytics or troubleshooting application crashes. Adding Newtest to your existing Nagios installation greatly enhances traditional IT Ops analysis, providing unique correlation between ...
Newtest is a unique source of information when it comes to performance analytics or troubleshooting application crashes. Adding Newtest to your existing Nagios installation greatly enhances traditional IT Ops analysis, providing unique correlation between ...


