
Search Exchange
Search All Sites
Nagios Live Webinars
Let our experts show you how Nagios can help your organization.Login
 New Listings
Directory Tree
Directory
Search Results
The search results below show both sub-categories and individual listings that match your search criteria.
Meet The New Nagios Core Services Platform
Built on over 25 years of monitoring experience, the Nagios Core Services Platform provides insightful monitoring dashboards, time-saving monitoring wizards, and unmatched ease of use. Use it for free indefinitely.
Monitoring Made Magically Better
- Nagios Core on Overdrive
- Powerful Monitoring Dashboards
- Time-Saving Configuration Wizards
- Open Source Powered Monitoring On Steroids
- And So Much More!
Submit Your Nagios Project!
Help build Nagios Exchange for yourself and the entire the Nagios Community by your Nagios project to the site. It's easy - just create an account, login, and add a new listing. Read the FAQ for instructions.check_m1000e
I really like the check_dell_bladechassis plugin, but I wanted to have graphs from the fans and some more event monitoring for our DELL M1000e chassis. =========== INFORMATION ABOUT THIS PLUGIN =============== This plugin checks the status of fans, ...
check_lustre
Simple check plugin to monitor the health and filesystem size of one or more lustre filesystems. This check must be run on a system that mounts the monitored lustre filesystems. Uses 'lfs df' to gather info on filesystems so it should not use any costly ( ...
check_logicaldisks.pl
This is the ultra hack mashup to have a nagios check that can check a ton of difference performance counters for multiple logical disks and alert if one or more are lower than the given warn/crit values.
check_loadaverage
 This is a plugin designed using Bash script.
This plugin is created so that 'Performance Gauges' in Nagios XI work properly, showing appropriate 'Warning' and 'Critical' regions.
This is a plugin designed using Bash script.
This plugin is created so that 'Performance Gauges' in Nagios XI work properly, showing appropriate 'Warning' and 'Critical' regions.
check_lm_perf_data
Generate performance data about all or a specific feature of a flexlm license via lmutil.
check_linux_net
a very extendable network monitoring tool. There are tons of arguments you can use to have this do anything you want. It's very low resource and has performance monitoring.
check_jvm
check_jvm checks various properties of locally running JVMs and returns performance data
check_jmxeval
JMXEval is a really flexible plugin for monitoring Java applications using JMX. Instead of just checking just an attribute of an MBean, JMXEval allows you to query multiple MBean attributes as well as results of MBean method invocations, and also perform ...
check_ipmi.pl - plugin for checking SUN hardware via IP...
check_ipmi.pl checks SUN Servers with ILOM/IPMI interface and reports the FAN/Temp ... values as performance data.
check_iperf
check network performance of a link with iperf on unix/windows
check_inodes.sh
Plugin for checking count of inodes on a partition. The total amount of free/used inodes will be checked, where multiple partitions may be checked in the same run. Supports pnp4nagios for creation of performance graphs. Usage: check_inodes -w [warn ...
check_imap_login v2
Python plugin for executing a imap login based on check_imap_login by Bertera Pietro (http://exchange.nagios.org/directory/Plugins/Network-Protocols/IMAP4-and-POP3/check_imap_login-Plugin/details) This plugin check if a imap log is executed correctly. ...
check_iftraffic5.pl
Supports all Cisco standard interfaces: TenGigabitEthernet, GigabitEthernet, FastEthernet, Ethernet, Port-channel, Vlan. Also works on standard NIC adaptors. Checks input/output traffic, unicast pkts, multicast pkts, broadcast pkts, errors and discar ...
check_iferrors_percent
This program is a Nagios check the monitors percentage error rates on a host's network interfaces. Error rates of more than 1% are often detrimental to application performance and are frequently an indication of a failing circuit or interface. This check ...
check_ifconfig
check_ifconfig is a Nagios plugin to network Ethernet interfaces on Linux platforms. It uses the output of ifconfig and reports the status of the network interface and the following parameters as performance data: RX bytes, TX bytes, RX packets, TX packet ...
check_IBM_performance
Plugin for monitoring IBM Storage performance. Tested it on DS4100 & DS4700 & DS3512 (You have to have a compatible SMcli version - Storage Manager 10.70.A5 is working for me). Please use LATEST version. You must install Storage manager client for the ...
check_http_content (updated)
check_http_content-updated- Nagios script by CapSiDE SL - has been updated to generate graphs for pnp4nagios #------------------------------------------------------------------------------ # Updated by Vahid Hedayati April 2013 - (improves nagio ...
check_hp Popular
Check CPUs, fans, array controllers, logical / physical drives, temperature and power supplies on your Proliant servers or blade systems through SNMP. As of version 2.20 you can use this plugin to retrieve performance data for Smart Array CPUs.
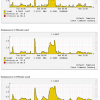
check_hastats
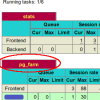 This plugin checks the HA Proxy Node Statistics and provides performance values...
check_hadoop_metrics
Checks the Metrics HTTP page of a Hadoop NameNode for a given performance metric.


