
Search Exchange
Search All Sites
Nagios Live Webinars
Let our experts show you how Nagios can help your organization.Login
 New Listings
Directory Tree
Directory
Search Results
The search results below show both sub-categories and individual listings that match your search criteria.
Meet The New Nagios Core Services Platform
Built on over 25 years of monitoring experience, the Nagios Core Services Platform provides insightful monitoring dashboards, time-saving monitoring wizards, and unmatched ease of use. Use it for free indefinitely.
Monitoring Made Magically Better
- Nagios Core on Overdrive
- Powerful Monitoring Dashboards
- Time-Saving Configuration Wizards
- Open Source Powered Monitoring On Steroids
- And So Much More!
Submit Your Nagios Project!
Help build Nagios Exchange for yourself and the entire the Nagios Community by your Nagios project to the site. It's easy - just create an account, login, and add a new listing. Read the FAQ for instructions.Maximizing XI Performance
This document describes how to maximize the performance of your Nagios XI server in a non-distributed environment. This document will discuss maximizing active checks on a single Nagios XI server, and is intended for Administrators using primarily active ...
Matt Wall - Performance Graphing and Trending In Nagios
This presentation covers graphing/trending topics, with nagiosgraph as the example implementation and covering some best practices (e.g. rrdtool issues, data collection options, data freshness, host/service naming, aggregation versus specialization, autom ...
MarkLogic Plugin for Nagios
The MarkLogic Plugin for Nagios gives administrators a central place to manage all of their infrastructure, leveraging their organization's existing processes, tools, and knowledge to reduce costs. By integrating seamlessly into Nagios, the plugin allows ...
Linux Route Check
A tool for checking routes on a linux device. This is great for environments with regularly changing networks, it outputs performance data when routes are added or deleted. I used it to keep track of the multiple routes we have to and from our SAN netw ...
Linux CPU Check with Top 5 Processes
This Plugin provides hopefully all the info you would ever need about your CPU: - Returns Stats for User, System, and IOWait - Allows for setting Warning/Critical levels globally or for each individual stat - When a Warning or Critical threshold is ...
jmeter invocation plugin II
This script is a rebuild of another jmeter plugin that invokes an Apache JMeter (available from http://jakarta.apache.org/jmeter) test plan and parses the results, which are returned to Nagios per plugin API defined exit statuses and performance data.
Ironport plugin with perfdata
This is a script to check RAM, CPU, QUEUE, Work Queue, and Mail Rate and other important parameters on Ironport Appliances and it returns performance data for graphing the results.
Iostat - check_tps
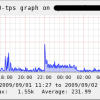 Nagios plugin/script to check the disk statistic TPS aka IOPS on a Linux machine. I also included a | after the output for performance statistics.
Usage:
Usage: check_tps.sh [-w|--warning] [-c|--critical]
[root@foobar libexec]# ./check_tps.sh -w 20 ...
Nagios plugin/script to check the disk statistic TPS aka IOPS on a Linux machine. I also included a | after the output for performance statistics.
Usage:
Usage: check_tps.sh [-w|--warning] [-c|--critical]
[root@foobar libexec]# ./check_tps.sh -w 20 ...
Integrating Mod Gearman with Nagios XI
The following is a documented guide on how to install Mod Gearman locally on your Nagios XI system(s) and from there tie it in with external worker systems to offload checks from the hardware Nagios XI resides on. This will reduce check latency and increa ...
InfiniBand Performance Counters Check
The plugin check_iberr.pl checks and reports the status of InfiniBand network adapters (RcvErrors, LinkDowned, XmtDiscards, etc.). Either the performance/error counters were checked remotely via InfiniBand (very fast) or via NRPE on the specific host.
Improve Nagios Performance Using RAMDISK
This tutorial demonstrates how to use RAMDISK in order to improve Nagios performance.
IIS Dashboard
 The IIS dashboard for nagios log server will allow you to visualize many different variations of response time compared to various metrics. Other informative details such as, most and least found instances of useragent, uri, and response code, provide a w ...
IBM Storwize v7000 Performance
Plugin to check storage's performance. It doesn't need any extra libraries.
http-json - Rule based JSON parser via http(s)
This is a generic plugin for Nagios which checks json values from a given HTTP endpoint against argument specified rules and determines the status and performance data for that service.
High Performance NCSA Alternative for Nagios
This tutorial demonstrates how to setup a NSCA alternative for Nagios.
gulm_lockspace
GFS Performance data. Returns values from /proc/gulm/lockspace for trending purposes
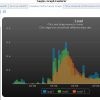
Graph Explorer Component
 This is a Nagios XI Customer Download. This component requires Nagios XI 2011R1.3 or later.
The Graph Explorer component utilizes javascript libraries to create interactive graphing tools for Nagios XI, including zoomable performance graphs, time-stack ...
This is a Nagios XI Customer Download. This component requires Nagios XI 2011R1.3 or later.
The Graph Explorer component utilizes javascript libraries to create interactive graphing tools for Nagios XI, including zoomable performance graphs, time-stack ...
GFS Counters
GFS performance data. Returns values under Absolute from "gfs_tool counters" for trending purposes.
Generating Graphs With Nagios XI
This document describes how to view graphs of the devices you are monitoring in Nagios XI. This document is intended for use by Nagios Users and Administrators who need to view graphs of their performance data in Nagios XI.


