
Search Exchange
Search All Sites
Nagios Live Webinars
Let our experts show you how Nagios can help your organization.Login
 New Listings
Directory Tree
Directory
Search Results
The search results below show both sub-categories and individual listings that match your search criteria.
Meet The New Nagios Core Services Platform
Built on over 25 years of monitoring experience, the Nagios Core Services Platform provides insightful monitoring dashboards, time-saving monitoring wizards, and unmatched ease of use. Use it for free indefinitely.
Monitoring Made Magically Better
- Nagios Core on Overdrive
- Powerful Monitoring Dashboards
- Time-Saving Configuration Wizards
- Open Source Powered Monitoring On Steroids
- And So Much More!
Submit Your Nagios Project!
Help build Nagios Exchange for yourself and the entire the Nagios Community by your Nagios project to the site. It's easy - just create an account, login, and add a new listing. Read the FAQ for instructions.stat_dev.pl
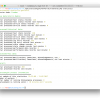
Check the IO and MB/s for an Device to generate graphs from the performance data. For multipath device returns the data from all devices and the sum.
Statusengine
 Statusengine is a project to process and store event data collected by Nagios. Statusengine will save all monitoring data to MySQL, CrateDB or Redis. It also has an inbuild performance data processor, which is able to save perfdata to Graphite, CrateDB, E ...
SNMP checking for IBM Bladecenters with performance dat...
Based on https://exchange.nagios.org/directory/Plugins/Network-Protocols/SNMP/SNMP-checking-for-IBM-Bladecenters with a few added checks and performance data. This module Tests various aspects of the IBM Bladecenter using the SNMP interface of the Mana ...
SmiStat
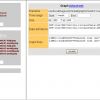 Smistat is a set of CGI-Perl scripts used to generate RRDTool graphs using performance data provided by Nagios plugins. It includes a web-based graph wizard for those who are not experienced with RRDtool.
SMB Connection
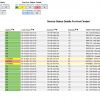
![]() Powershell Script to check SMB Connection on Windows Server.
Works with Windows 2012 and higher.
Output: OK: SMB1=0, SMB2=7, SMB3=14 Connections active
Connections seperated for every Version.
Shows Performancedata and IP, Computername, User and SMB ...
Powershell Script to check SMB Connection on Windows Server.
Works with Windows 2012 and higher.
Output: OK: SMB1=0, SMB2=7, SMB3=14 Connections active
Connections seperated for every Version.
Shows Performancedata and IP, Computername, User and SMB ...
sipnagios
Nagios Plugin to check Call Quality in SIP VoIP (compatible with checkmk, etc) sipnagios implements the Nagios plugin API for monitoring and performance data. sipnagios.c is a modification of the original siprtp.c sample in pjproject distribution. S ...
Simple pCOWEB temperature check with alarms.
 Perl script to check the room temperature by probing the pCOWEB module through SNMP.
With Nagios compatible performance info.
Perl script to check the room temperature by probing the pCOWEB module through SNMP.
With Nagios compatible performance info.
Simple Datadomain performance plugin
Simple plugin that will return you CIFS read/write performance and netrwok IO using ssh. Requires Dadatomain name/IP address, username and password. Can be extended to support key authentication. Before running plugin you must connect once to your DD f ...
sgichk_snmp_system
Fetches/checks system performance stats via SNMP from net-snmp or mib2 host agents including many types of CPU usages (User, System, Wait, Idle, etc), memory/swap usage, load averages, paging/swapping rates. Includes pnp4nagios template and nagvis gadget.
Send HTML Alert Email v3
 This is the Version 3 of the popular 'Send HTML Alert Email'. Nagios Alert eMails now contain formatted Text & Performance Graphs. Tested with Nagios v3 & 4.
Contains Useful Features Like ---
1) Performance Graphs
2) Total Downtime of the Service upon ...
This is the Version 3 of the popular 'Send HTML Alert Email'. Nagios Alert eMails now contain formatted Text & Performance Graphs. Tested with Nagios v3 & 4.
Contains Useful Features Like ---
1) Performance Graphs
2) Total Downtime of the Service upon ...
SAP HANA Database check health
 A Nagios plugin for monitoring SAP HANA database by SQL command and without installation on SAP server. You need just a user access with MONITORING role. (see PREREQUISITE.TXT file)
It will open the door to many idea to monitor health and Key Performan ...
A Nagios plugin for monitoring SAP HANA database by SQL command and without installation on SAP server. You need just a user access with MONITORING role. (see PREREQUISITE.TXT file)
It will open the door to many idea to monitor health and Key Performan ...
Sam Weather 2.0
 Weather plugin for Nagios that lets you check temperature, humidity, wind, rain fall, dewpoint, heat index, windchill, pressure, solar radiation, and UV index. This also reports performance data to Nagios for graphing. The plugin uses data from Weather ...
Repairing The Nagios XI Database
Nagios XI stores current and historical information in various databases in order to facilitate reports and provide users with instant information on monitored elements. Over time the Nagios XI database tables may grow to excessive size, resulting in poor ...
QNAP NAS volume status
This plugin sends SNMP queries to a QNAP NAS and verifies the state of all volumes (status, space free). The free space is returned as performance counter. Tested on a QNAP TS-259 Pro+ with firmware 3.8.4
QNAP NAS system temperature
This plugin sends SNMP queries to a QNAP NAS and checks the cpu and system temperature. The temperature is returned as performance counter. Tested on a QNAP TS-259 Pro+ with firmware 3.8.4
QNAP NAS harddisk status
This plugin sends SNMP queries to a QNAP NAS and verifies the state of all harddisks (temperature, status, SMART info). The temperature is returned as performance counter. Tested on a QNAP TS-259 Pro+ with firmware 3.8.4
Profiler to check plugin execution time
This is a simple perl script that parses /var/log/nagios/status.dat and prints how long execution of each service type took. Useful for performance tuning. THIS IS NOT A PLUGIN - it is a console utility.
Postgres Server Monitoring Wizard
![]() A Nagios XI wizard for monitoring various performance metrics of a Postgres database server - including connection status, backend connections, and WAL files.
A Nagios XI wizard for monitoring various performance metrics of a Postgres database server - including connection status, backend connections, and WAL files.
Postgres Database Monitoring Wizard
![]() A Nagios XI wizard for monitoring various performance metrics of a Postgres database - including connection status, database size, table sizes, relation sizes, and remaining sequences.
A Nagios XI wizard for monitoring various performance metrics of a Postgres database - including connection status, database size, table sizes, relation sizes, and remaining sequences.
PNP4Nagios
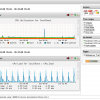 PNP is an addon to Nagios which analyzes performance data provided by plugins and stores them automatically into RRD-databases (Round Robin Databases, see RRD Tool).


