Search Exchange
Search All Sites
Nagios Live Webinars
Let our experts show you how Nagios can help your organization.Login
Directory Tree
Directory
Search Results
The search results below show both sub-categories and individual listings that match your search criteria.Meet The New Nagios Core Services Platform
Built on over 25 years of monitoring experience, the Nagios Core Services Platform provides insightful monitoring dashboards, time-saving monitoring wizards, and unmatched ease of use. Use it for free indefinitely.
Monitoring Made Magically Better
- Nagios Core on Overdrive
- Powerful Monitoring Dashboards
- Time-Saving Configuration Wizards
- Open Source Powered Monitoring On Steroids
- And So Much More!
Submit Your Nagios Project!
Help build Nagios Exchange for yourself and the entire the Nagios Community by your Nagios project to the site. It's easy - just create an account, login, and add a new listing. Read the FAQ for instructions.- Performance (13 listings)
- Performance (2 listings)
Perl check_selenium Featured
 Check_selenium is a Nagios friendly check designed to pass selenium Perl scripts through to a remote system. In this way you can control web based automation and testing through Selenium via Nagios. The checks return all performance data in a way readable ...
nagiosgraph Featured
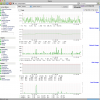 nagiosgraph parses output and performance data from Nagios plugins, and stores the data in RRD files. nagiosgraph displays data in Nagios trends, as popups for hosts and services, or in separate reports. Easy to set up but eminently customizable.
Nagios V-Shell Featured Popular
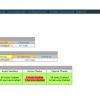 Nagios V-Shell is a PHP web interface to Nagios Core that is designed to be lightweight, easy to install and use, and customizable. As of v1.7, V-Shell now has gettext support for internationalization.
Version 1.9 has now been overhauled for substant ...
n2rrd Featured
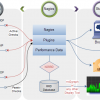 N2RRD (Nagios to Round Robin Database) is a Nagios add-on tool, which stores performance data generated by Nagios plugins into an Round-Robin-Database (see RRDtool). The package also includes the display tool rrd2graph to view data stored in an RRD databa ...
Exchange Server Monitoring Wizard Featured
![]() This Nagios XI wizard allows you to easily monitor Microsoft Exchange servers - including service states, protocol availability, and performance metrics.
This Nagios XI wizard allows you to easily monitor Microsoft Exchange servers - including service states, protocol availability, and performance metrics.
check_linux_stats Featured
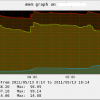 Plugin to check linux system performance (cpu, mem, load, disk usage, disk io, network usage, open files and processes).
A perl plugin using Sys::Statistics::Linux
Thanks to Jonny Schulz, the author of Sys::Statistics::Linux, for his great work (ht ...
wrap_multi
This script runs the specified Nagios-plugin, captures stdout and reformats the performance-data to multi-label-format as specified by check_multi. It has been designed for check-scripts, which check several instances (f.e. disks) on one system.
Windows Server Monitoring Wizard
![]() This Nagios XI wizard allows you to easily monitor a Microsoft® Windows 2000, 2003, or 2008 server. Allows you to monitor CPU, memory, disk usage, services, processes, and performance counters.
This Nagios XI wizard allows you to easily monitor a Microsoft® Windows 2000, 2003, or 2008 server. Allows you to monitor CPU, memory, disk usage, services, processes, and performance counters.
Watchguard Network
 This plugin checks bandwidth and connections of Watchguard device and returns performance data.
Watchguard Memory
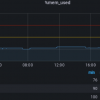 This plugin checks memory usage of Watchguard device and returns memory and swap performance data:
Watchguard Load
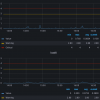 This plugin checks load of Watchguard device and returns load performance data
Watchguard CPU
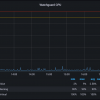 This plugin checks CPU usage of Watchguard device and returns CPU performance data.
Using rrdcached with Nagios XI
This document describes how to enable rrdcached with Nagios XI as a step to improve performance and reduce disk I/O on large installations. rrdcached is a daemon that receives updates to existing RRD files, accumulates them and, if enough have been recei ...
UPS Socomec Sicon Netvision
This is a first try at the Socomec Sicon Netvision UPS. What it does: verify output voltage (currently only the first element of 3; this defaults to a warning below 200 volts) verify output load in percent (currently only the first element of ...
UPS Checks
Three perl scripts to monitor APC, Merlin Guerin and Powerware UPS. Performance data are also provided using groundwork like syntax. Updated by Alexander Rudolf - added support for external temperature sensor (exttemp...) Hint: expecting the value ...
UNIX/LINUX SNMP CPU IDLE with STATs
 This plugin monitors CPU Idle of UNIX/LINUX OS and gets a lot of additional Info from SNMPD.
Plugin checks are made via SNMP v2c/3 and returns CPU Idle percent in Output and Perfdata and other stats in Performance data.
REQUIRE include .1.3.6.1.4.1.20 ...
This vbscript will monitor processes on Windows Systems...
The processes to be monitored are described in a .ini file in the same directory as the .vbs file. Information about processes to be monitored is stored on the monitored server, allowing people to add or remove processes to monitor without logging to the ...
TCP traffic degradation detection from link utilization
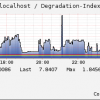 This plugin estimates the TCP traffic performance degradation from coarse link utilization traces, such as those obtainable by SNMP.
Syabru Nagios JMX Plugin
Nagios JMX plugin to retrieve and monitor runtime data from Java VM's and other applications supporting JMX. The plugin supports Nagios performance data and operation invocation on MBeans for resetting statistical data or counters. It also supports regula ...
stat_net.pl
Check the IO and MB/s for an network device to generate graphs from the performance data.

 Directory
 New Listings