
Search Exchange
Search All Sites
Nagios Live Webinars
Let our experts show you how Nagios can help your organization.Login
 New Listings
Directory Tree
check_loadaverage
Current Version
1.0
Compatible With
- Nagios 3.x
- Nagios 4.x
- Nagios XI
Owner
Download URL
Hits
24130
Files:
| File | Description |
|---|---|
| check_loadaverage.sh | check_loadaverage plugin file |

Meet The New Nagios Core Services Platform
Built on over 25 years of monitoring experience, the Nagios Core Services Platform provides insightful monitoring dashboards, time-saving monitoring wizards, and unmatched ease of use. Use it for free indefinitely.
Monitoring Made Magically Better
- Nagios Core on Overdrive
- Powerful Monitoring Dashboards
- Time-Saving Configuration Wizards
- Open Source Powered Monitoring On Steroids
- And So Much More!
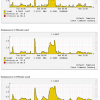
This plugin is created so that 'Performance Gauges' in Nagios XI work properly, showing appropriate 'Warning' and 'Critical' regions.
For Performance Gauges to show details properly, performance data should be in following format:
'VarName'=CurrentValue Unit;WarningValue;CriticalValue;MininumValue;MaximumValue
Important:
1. It uses the output of 'uptime' command.
2. Warning and Critical thresholds are 80% and 90% of the total number of processor cores.
For Ex: If you are using 16 core processor, Warning threshold will be 80% of 16 i.e. '12.8' and Critical threshold will be 90% of 16 i.e. '14.4'
3. If the calculated value, may it be 1 min load, 5 min load or 15 min load, exceeds the thresholds, status will be set accordingly (OK, WARNING or CRITICAL).
How To Use:
To monitor remote Linux server:
1. Keep the plugin in /usr/local/nagios/libexec directory.
2. Add following line to the nrpe.cfg file:
command[check_loadaverage.sh]=sudo /usr/local/nagios/libexec/check_loadaverage.sh
3. Add the following line to /etc/sudoers file:
nagios ALL=(ALL) NOPASSWD:/usr/local/nagios/libexec/check_loadaverage.sh
Usage:
On Monitoring Server:
./check_nrpe -H 128.9.45.13 -c check_loadavg.sh
Output:
OK- Load Average: 0.09, 0.05, 0.01 | load1=0.09;6.4;7.2;; load5=0.05;6.4;7.2;; load15=0.01;6.4;7.2;;


