
Search Exchange
Search All Sites
Nagios Live Webinars
Let our experts show you how Nagios can help your organization.Login
 New Listings
Directory Tree
Directory
Search Results
The search results below show both sub-categories and individual listings that match your search criteria.
Meet The New Nagios Core Services Platform
Built on over 25 years of monitoring experience, the Nagios Core Services Platform provides insightful monitoring dashboards, time-saving monitoring wizards, and unmatched ease of use. Use it for free indefinitely.
Monitoring Made Magically Better
- Nagios Core on Overdrive
- Powerful Monitoring Dashboards
- Time-Saving Configuration Wizards
- Open Source Powered Monitoring On Steroids
- And So Much More!
Submit Your Nagios Project!
Help build Nagios Exchange for yourself and the entire the Nagios Community by your Nagios project to the site. It's easy - just create an account, login, and add a new listing. Read the FAQ for instructions.Instalación y configuración de Nagios Core 4.0.4
En este documento se explica como instalar y configurar Nagios Core con algunos plugins, todo esto corriendo sobre Debian. En su interior se explica: - Qué es Nagios. - Preparación e instalación de Nagios en un equipo Linux. - Instalación de plu ...
Insight Management Logs
![]() Check the status of HP Insight Logs. This is a revision of Frank Baschin' plugin. It presents more helpful information and accurate status codes.
Check the status of HP Insight Logs. This is a revision of Frank Baschin' plugin. It presents more helpful information and accurate status codes.
inservice
This application to monitoring who access nagios server or other client computer from remote computer. So you can prevent your server from people attack or unknown user login into your server. You can use this application to monitoring ssh connection, ...
InfiniBand Performance Counters Check
The plugin check_iberr.pl checks and reports the status of InfiniBand network adapters (RcvErrors, LinkDowned, XmtDiscards, etc.). Either the performance/error counters were checked remotely via InfiniBand (very fast) or via NRPE on the specific host.
iNag2
 iNag2 is the encore to the award wining app used by thousands of network administrators around the world.
• Process information and control
• Available Push Alerts
• Host and Service grouping.
• Comments viewable for both Host and Services. ...
iNag2 is the encore to the award wining app used by thousands of network administrators around the world.
• Process information and control
• Available Push Alerts
• Host and Service grouping.
• Comments viewable for both Host and Services. ...
In-depth checks for JBoss Java EE Server
This plugin provides a Perl Nagios plugin and a simple drop in deployment for JBoss. The combination of the two enable in-depth checks of nearly every aspect of the server. No JDK installation required on the Nagios server.
Importing Nagios XI into Microsoft Hyper-V
The purpose of this documentation is to provide a guide on importing the Nagios XI virtual machine into a Microsoft Hyper-V environment. This guide is directed towards Microsoft and Nagios administrators interested in running the Nagios XI virtual mach ...
Importing Config Files Into XI
This document describes how to migrate and import Nagios Core configuration files into Nagios® XI™. Importing configuration files is only required in instances where administrators wish to import configurations from existing Nagios Core installations. ...
iLert Notification Plugin (Voice, SMS, iPhone)
 iLert extends Nagios and other monitoring tools with On-Call Schedules, Voice, SMS, and Push Notification capabilities. iLert is provided as a cloud service and is easy to setup.
IIS Dashboard
 The IIS dashboard for nagios log server will allow you to visualize many different variations of response time compared to various metrics. Other informative details such as, most and least found instances of useragent, uri, and response code, provide a w ...
IIS Application Pool (AppPool) Extended Check
 With this simple script it's possible to monitor all application pools without adding something to your configuration file or add a new service check.
its simply designed. checking every application pool in the IIS7 (maybe 6/8) not tested yet.
Its po ...
With this simple script it's possible to monitor all application pools without adding something to your configuration file or add a new service check.
its simply designed. checking every application pool in the IIS7 (maybe 6/8) not tested yet.
Its po ...
IBM Storwize V7000 check_ibm_v7000_svc
Checks several states of IBM V7000 SVC via perl module IBM::SVC (enclosures, drives, arrays, batteries, psu's canisters, enclosureslots, vdisks and consistency group states). you may exclude some objects for vdisk and consistency group checks.
IBM SAN Volume Controller (SVC) and IBM Storvize Monito...
 Perl script uses Expect to login to IBM SAN Volume Controller (SVC) or IBM Storvize device via ssh. There is no additional software required. Can be used for nagios, op5, etc. monitoring.
IBM Connections plugins
Nagios Plugins for IBM Connections These Nagios Plugins can be used to monitor an IBM Connections environment.
IBM - nagios-for-i
Have an IBM i? You can monitor it with the IBM i Service and IBM i Custom SQL wizard. Download them both!
Hypermap Component
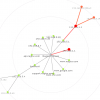 The newly designed hypermap component for Nagios XI makes it easier than ever to get a quick overview of the status of your network. The hypermap support dynamic updates via ajax, scrolling and zooming.
Huawei_Storage_Nagios_Plugin_linux
The Huawei eSDK Array Management Plug-in (for Nagios) is installed in the Nagios tool. After the installation, the Nagios tool can manage Huawei OceanStorV3, OceanStorV5 and DoradoV3 devices, as well as keep the system information, LUNs, alarms, and cont ...
http-json - Rule based JSON parser via http(s)
This is a generic plugin for Nagios which checks json values from a given HTTP endpoint against argument specified rules and determines the status and performance data for that service.
HP Procurve SNMP monitor
This plugin checks the health of HP Procurve switches via SNMP queries.
HP Procurve SNMP counters
This plugin gets a series of port counters (indexes, drops, CRC aligns errors, runts, giants, fragments, jabbers...) from HP switches via SNMP queries.


