Search Exchange
Search All Sites
Nagios Live Webinars
Let our experts show you how Nagios can help your organization.Login
Directory Tree
Directory
Search Results
The search results below show both sub-categories and individual listings that match your search criteria.Meet The New Nagios Core Services Platform
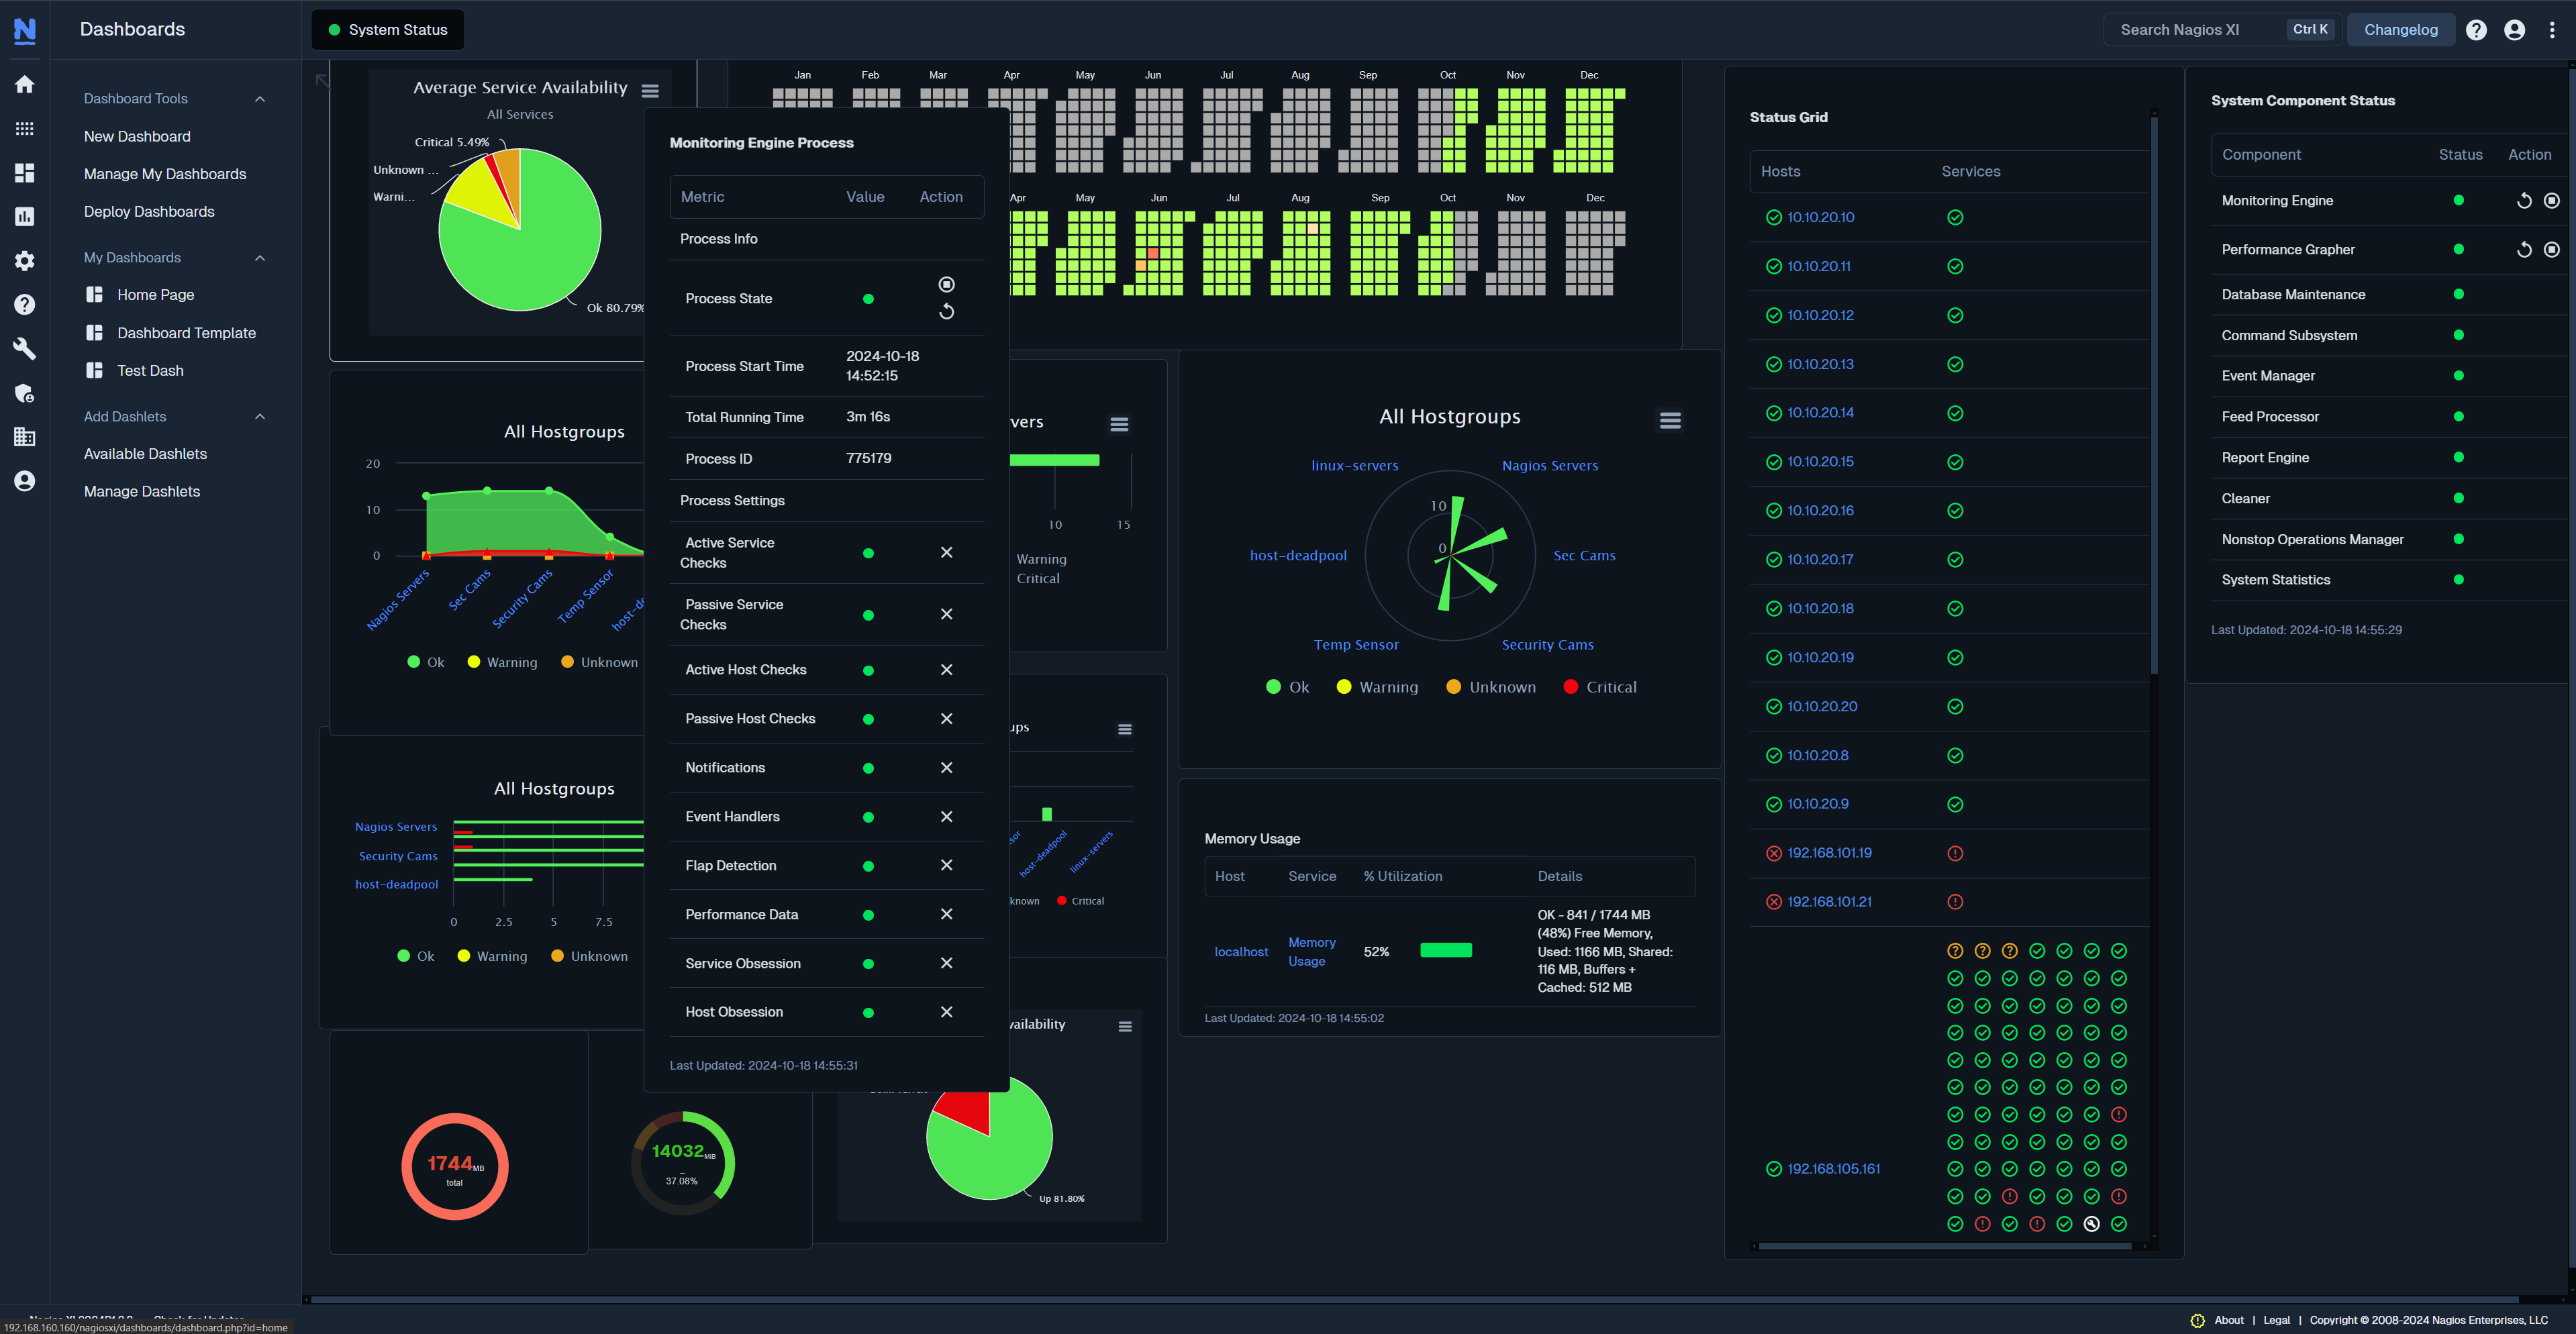
Built on over 25 years of monitoring experience, the Nagios Core Services Platform provides insightful monitoring dashboards, time-saving monitoring wizards, and unmatched ease of use. Use it for free indefinitely.
Monitoring Made Magically Better
- Nagios Core on Overdrive
- Powerful Monitoring Dashboards
- Time-Saving Configuration Wizards
- Open Source Powered Monitoring On Steroids
- And So Much More!
Submit Your Nagios Project!
Help build Nagios Exchange for yourself and the entire the Nagios Community by your Nagios project to the site. It's easy - just create an account, login, and add a new listing. Read the FAQ for instructions.Ping of multiple Hosts via icmp protocol
Multi Ping Useful to monitor VPN-Connections (Network-Tunnels) if the linkage is up & running between the 2 locations.
Ping Action
![]() This component adds an action to host and service detail screens that allows you to quickly ping the host or device. Useful for troubleshooting network connectivity.
This component adds an action to host and service detail screens that allows you to quickly ping the host or device. Useful for troubleshooting network connectivity.
PHP Nagios Traceroute and Ping
Want to View Ping & Traceroute results from your web browser, then this is the php script for you ! ;-)
pg_db_size
The pg_db_size plugin checks for the on disk size of any given PostgreSQL database.
pg_db_cache_hits
A PostgreSQL plugin that checks the database's cache hits percentage.
perl_nrdp.pl Client
This is a cross-platform Perl version of the official send_nrdp.py and send_nrdp.sh clients for NRDP.
Perl SNMP Printer check
Based upon a shell script that does snmp printer checks (see http://exchange.nagios.org/directory/Plugins/Hardware/Printers/SNMP-Printer-Check/details), I decided the performance would much better if it was written in perl. So I converted the script to pe ...
Perl scripts to monitor Windows servers by Winexe
The archive contains example scripts that use Winexe to execute commands or monitor something 1- check_winexe_remotecmd.pl : launch remotely a Windows command by winexe 2- check_winexe_powreshell_remotecmd.pl : launch remotely a PowerShell script by Win ...
Perl check radius with performance data like check_radi...
Fork of "Perl check radius" plugin that also outputs performance data in the format of check_radius_adv. Please see the original plugin for system requirements and instructions.
Perl check radius
This simplified plugin is written in Perl and uses the Authen::Radius module.
Perl check dhcp
This simplified plugin tests the availability of a given DHCP server using unicast delivery.
perfservmon
Nagios Plugin for IBM Websphere Application Server (WAS) using the perfservlet embedded application.
PerfParse
 PerfParse facilitates the storage and analysis of binary performance data produced by Nagios and produces high-quality accurate graphs of live data from standard Nagios plugins. A permanent history of plugin results can then be viewed with advanced analys ...
Performance History Graphs for Nagios with Nagiosgraph
Nagiosgraph is our most important extension to the monitoring system. There are several packages available for Nagios graphing, but at the time of implementation in 2008 the Nagiosgraph package was a lucky choice. Today we have more then 3740 service grap ...
Performance Data Tool
 The purpose of the Performance Data Tool is to give you the ability to view and manipulate the .rrd and .xml performance data files on your Nagios XI host. This can be helpful for: * Viewing graphs for services that have been disabled ** Because they are ...
Perform a file or directory operation
This action can be added into Nagios Reactor to perform one of several file operations.
PerfData
Various Perl scripts that can be used to automate graph generation.
perf2rrd
perf2rrd is a Java utility that will automate the extraction of performance data from Nagios plugins into round robin database files (.rrd's).
PDFReport
Creates a PDF or HTML summary report showing the availability over the last month for a specified hostgroup's members and their services. By Steve Shipway.
pcmeasure
Nagios plugin to check the current value from one pcmeasure sensor and return the appropriate status.

 Directory
 New Listings