
Search Exchange
Search All Sites
Nagios Live Webinars
Let our experts show you how Nagios can help your organization.Login
 New Listings
Directory Tree
Category: Performance
Nagios plugins for monitoring system performance metrics.

Meet The New Nagios Core Services Platform
Built on over 25 years of monitoring experience, the Nagios Core Services Platform provides insightful monitoring dashboards, time-saving monitoring wizards, and unmatched ease of use. Use it for free indefinitely.
Monitoring Made Magically Better
- Nagios Core on Overdrive
- Powerful Monitoring Dashboards
- Time-Saving Configuration Wizards
- Open Source Powered Monitoring On Steroids
- And So Much More!
Submit Your Nagios Project!
Help build Nagios Exchange for yourself and the entire the Nagios Community by your Nagios project to the site. It's easy - just create an account, login, and add a new listing. Read the FAQ for instructions.check_nagiostats
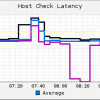 This plugin checks nagios performance data by parsing the nagios status.dat file, which is expected to be located at
"/usr/local/nagios/var/status.dat".
This version runs stable with host and service latency check on my nagios 3.2.2. Anyway, this plu ...
This plugin checks nagios performance data by parsing the nagios status.dat file, which is expected to be located at
"/usr/local/nagios/var/status.dat".
This version runs stable with host and service latency check on my nagios 3.2.2. Anyway, this plu ...
check_newrelic.pl
Check application performance as measured by NewRelic http://newrelic.com/ Alert on Apdex or Error-rate
check_nvidiasmi.sh
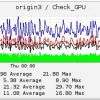 check nvidia GPU utilization
/usr/local/bin/check_nvidiasmi.sh
OK GPU - 32%; Memory - 12%; Encoder - 53%; Decoder - 23% | gpu=32% memory=12% encoder=53% decoder=23%
pnp4nagios template check_nvidiasmi.php
check nvidia GPU utilization
/usr/local/bin/check_nvidiasmi.sh
OK GPU - 32%; Memory - 12%; Encoder - 53%; Decoder - 23% | gpu=32% memory=12% encoder=53% decoder=23%
pnp4nagios template check_nvidiasmi.php
check_sa
check_sa is a Nagios plugin to check the status of one or more performance counters monitored through sa and sar in the Linux sysstat package.
check_sshr_nrdpr
 Agent-less monitoring plugin for NagiosXI that uses a single Windows_SSH service to request Windows LCD Metrics (CPU Utilization, Memory Utilization, Disk Utilization) and Service Status that are returned individually to NagiosXI via NRDP.
Data Recovery Download
www.datarecoverydownload.net website recommends Data recovery download software restores lost files and folder from usb drive without wasting time and valuable money. Data recovery software revives corrupted text documents damaged due to human mistake, lo ...
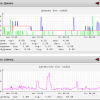
Nagios stats with graphs (nagiostats)
The script checks Nagios statistics from the nagiostats commands and reports perf data. I have created a pnp4nagios template which reports the following: - Graph 1 - Service status -> No. services in downtime -> No. services in warning -> No ...
nagstat
nagstats is a Nagios addon that runs Dag Wieers' dstat tool (http://dag.wieers.com/home-made/dstat/) , then parses coma-separated output, matches warn and crit and sends the results to nagios via nsca.
sbench
 Lightweight, tunable and simple benchmarking tool written in C that can be invoked through NRPE interface and performs tests on memory, CPU, disk and network.
sgichk_cuda_queues
 Check message queue sizes and average message latency on a Barracuda Spam Firewall
sgichk_snmp_system
Fetches/checks system performance stats via SNMP from net-snmp or mib2 host agents including many types of CPU usages (User, System, Wait, Idle, etc), memory/swap usage, load averages, paging/swapping rates. Includes pnp4nagios template and nagvis gadget.
stat_dev.pl
Check the IO and MB/s for an Device to generate graphs from the performance data. For multipath device returns the data from all devices and the sum.


