Search Exchange
Search All Sites
Nagios Live Webinars
Let our experts show you how Nagios can help your organization.Login
Directory Tree
Directory
Search Results
The search results below show both sub-categories and individual listings that match your search criteria.Meet The New Nagios Core Services Platform
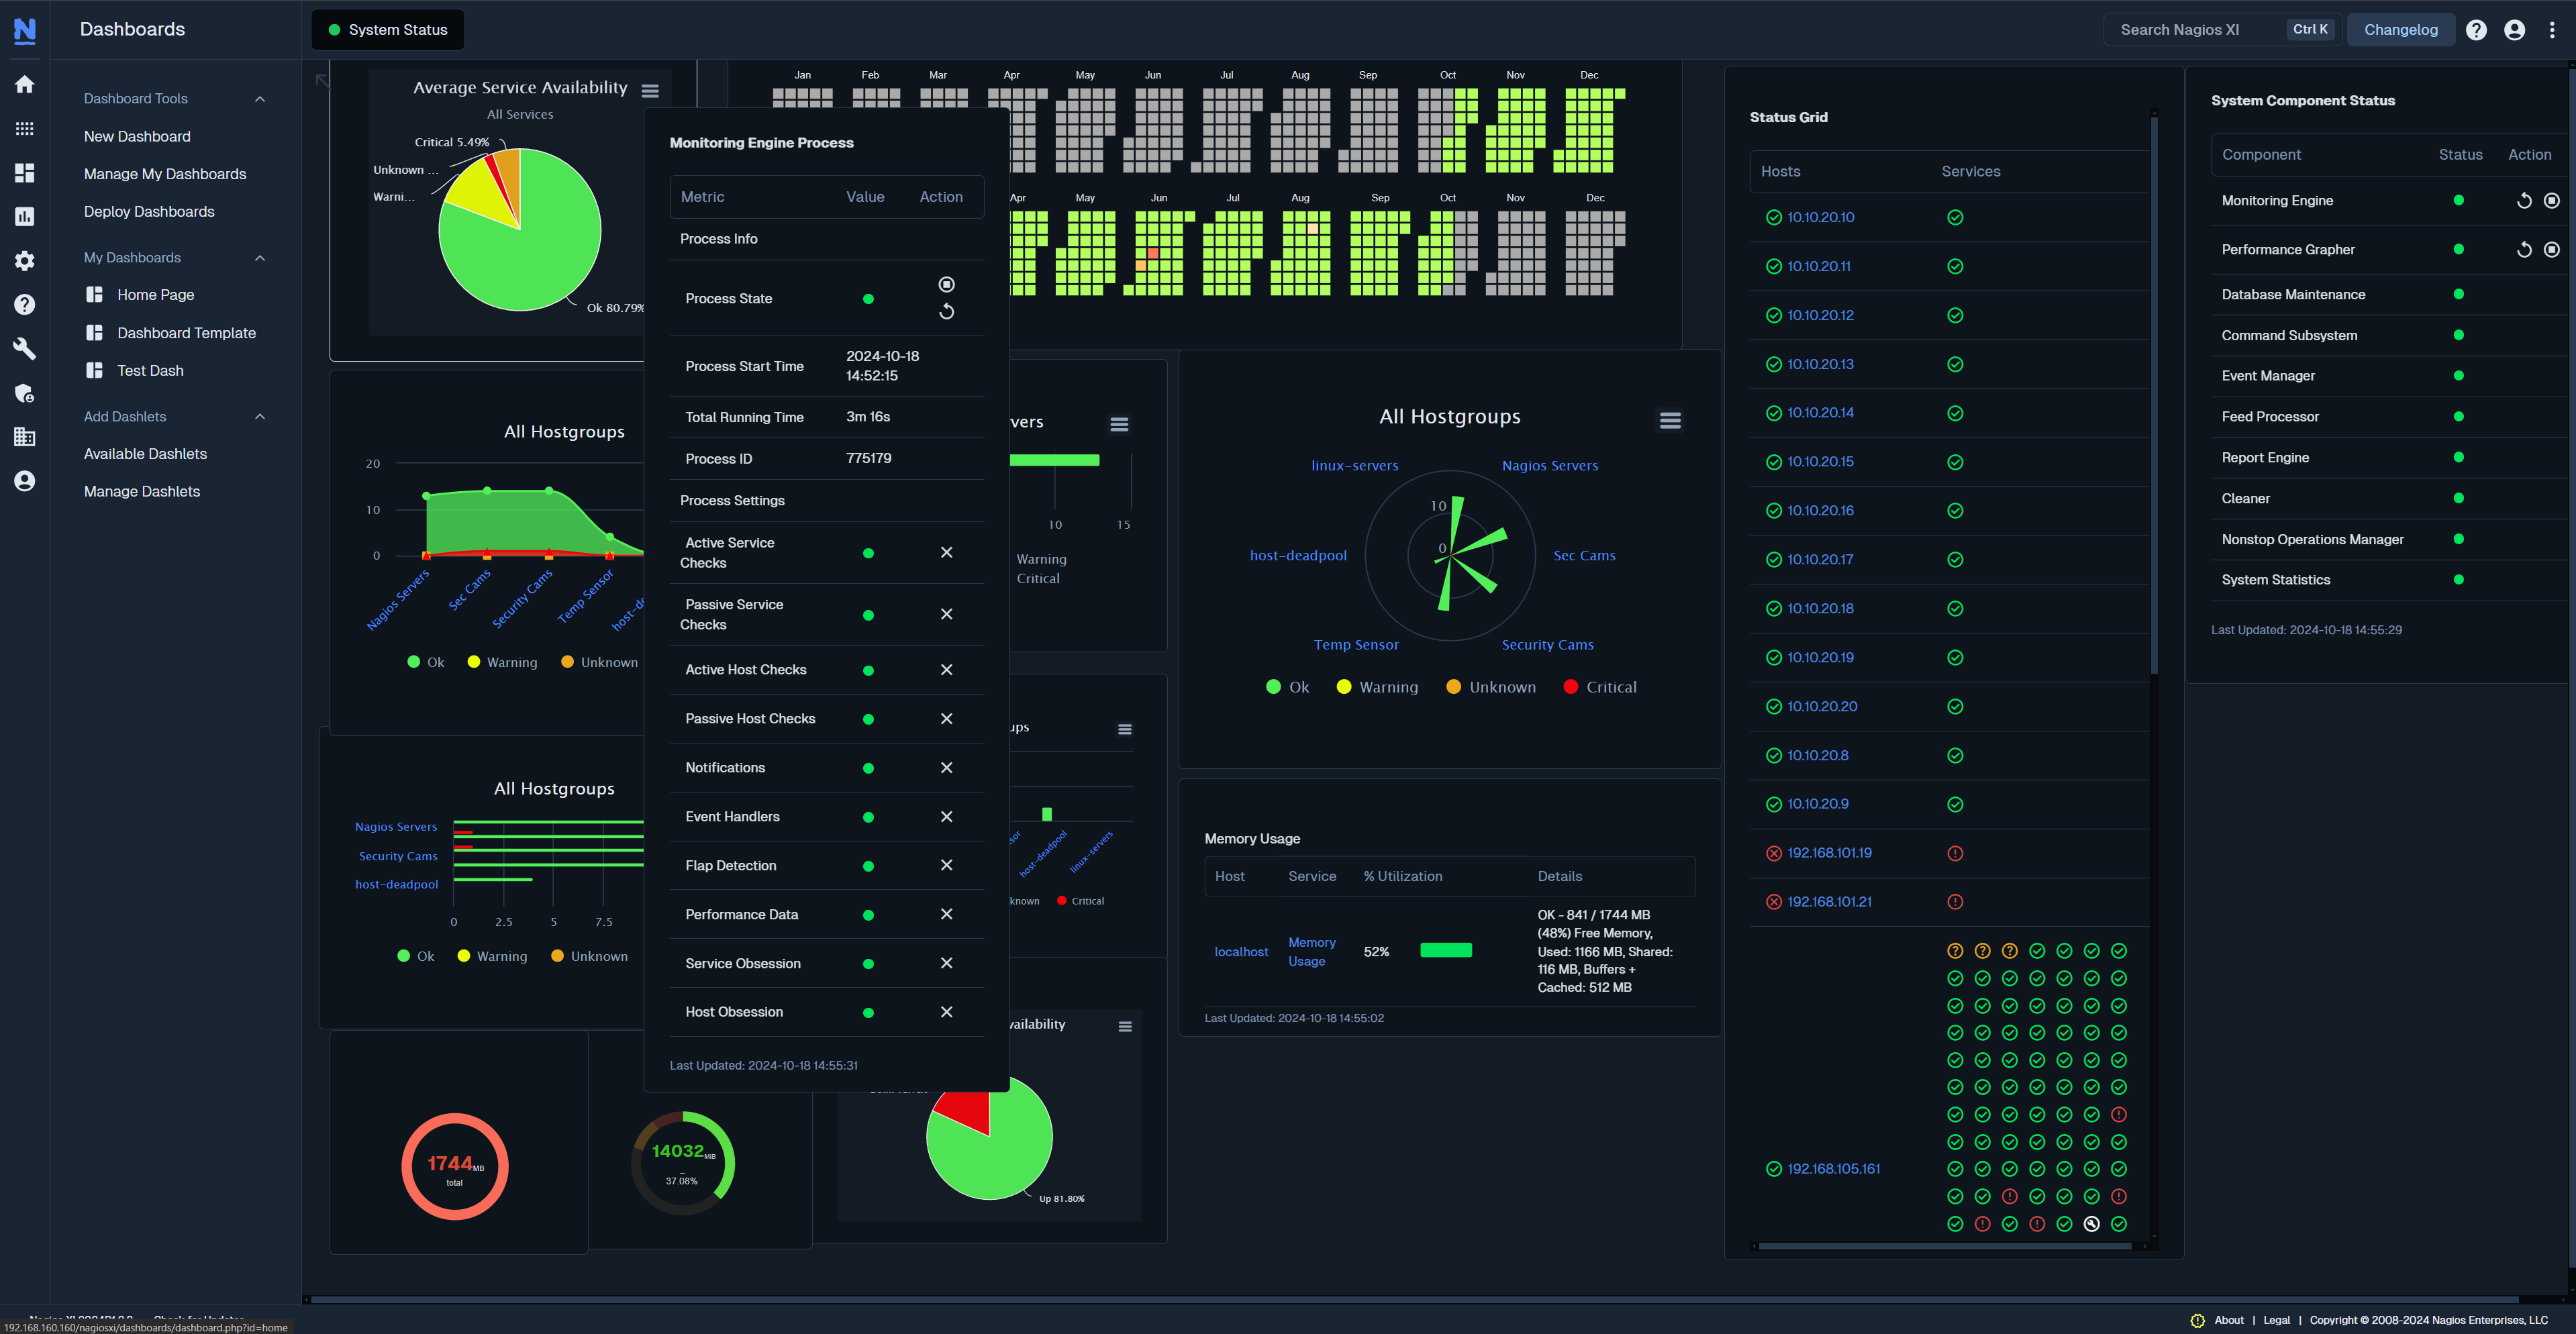
Built on over 25 years of monitoring experience, the Nagios Core Services Platform provides insightful monitoring dashboards, time-saving monitoring wizards, and unmatched ease of use. Use it for free indefinitely.
Monitoring Made Magically Better
- Nagios Core on Overdrive
- Powerful Monitoring Dashboards
- Time-Saving Configuration Wizards
- Open Source Powered Monitoring On Steroids
- And So Much More!
Submit Your Nagios Project!
Help build Nagios Exchange for yourself and the entire the Nagios Community by your Nagios project to the site. It's easy - just create an account, login, and add a new listing. Read the FAQ for instructions.check_amq
This active mq check script is looking for pending messages. It´s a shell script, just using the binary stuff that apache active mq is providing. Little slow, but does it´s job + sends performance data. Usage is: ./check_amq.sh , e.g. ./check_amq ...
Checks Dell Warranty information using SNMP
 New monitoring script for Dell Warranty using SNMP protocol; Provides performance data as well.
Dell has moved to a more secure method for obtaining information on devices (including warranty info). They moved away from API key (v4) to OAuthTLS2.0 (v5) ...
CheckFileCountWithPerf
This is identical to the original CheckFileCount done by Bernd Mueller. I've just updated it to include performance data as well for graphing by external programs. I also did a simple change that added the checked directory in the status text.
Check XenServer
Check Xenserver through its API (http://www.xenserver.org/partners/developing-products-for-xenserver.html) Ability to check : - Memory of all hosts in a pool (check_mem) - CPU of all hosts in a pool (check_cpu) - Storage Repositories in a pool (ch ...
Check Windows time against AD or target
Check local time against a provided source or AD(autodetect) or pool.ntp.org through NRPE / nsclient++. Windows Server that are not DC can't be tested through NTP by default. This powershell script is executed locally and compare time with w32tm tool ...
Check Windows Performance Monitor Counters
 Plugin for Nagios that allow to check a group of Windows performance counters given in a xml file.
It checks value of performance counters based on thresholds specified and returns exit and performance data in Nagios format.
Check used Swap on Linux
A simple shell script that checks the usage of swap in a Linux System. Intention was, that a system should never swap anything, it was not enough to watch free swap. Output includes performance data for pnp4nagios.
Check UPS Mode
![]() Checks working mode (online, bypass, offline, ...) on a RFC 1628 (UPS-MIB) compatible UPS. Manages battery load and backup time as performance data.
Checks working mode (online, bypass, offline, ...) on a RFC 1628 (UPS-MIB) compatible UPS. Manages battery load and backup time as performance data.
Check Unix Process
This Unix perl script checks if a process is running and its CPU, Memory, RSS or VSZ (or all of the above) if selects processes and their children and aggregates the data. It can find the process by name, arguments or by reading a .pid file. The script su ...
Check SAR memory page performance
There is a new shell script that monitors mempage performance using the linux sysstat package 'sar' tool. Feel free to update any improvements.
Check Quantum Scalar i2000 / i6000
![]() Perl plugin to check the status of the subsystems on a Adic/Quantum Scalar i2000/i6000 tape library. Also performance data now available.
Perl plugin to check the status of the subsystems on a Adic/Quantum Scalar i2000/i6000 tape library. Also performance data now available.
Check Quantum DXi Series
 Quantum DXi Series check for Nagios / Nagios XI.
The shell script will get the system and deduplication info from DXi systems. Performance data are also included.
DXi must have firmware 2.x to get data.
1.2
Check deduplication watermarks are not ...
check pop3 account
check_pop3_account.pl logs into a POP3 or POP3 over SSL (POP3S) account and reports the number of messages found. It can optionally generate alerts based on the number of messages found. Performance data is available in the form of the number of messages ...
Check Performance Monitor
Grabs values from Performance Monitor Counter. VBScript, calls typeperf.exe to get results. Code is sloppy, but free to use as needed.
Check Perfcounter (
Checks a "raw" performance counter.
Check OpCache Status
Check PHP OpCache Status and display some performance data.
Check NSCA Processes
Check for old NSCA processes, and optionally kill them off if found. Also, optionally return performance data regarding procs found, stale, and killed. Lots of configurable options in the shell script, and accepts two levels of verbosity (specify with ...
Check MySQL Table Status
Executes "show table status" queries for all schemas on the server. Parse the output. Gives Nagios compatible warning, critical notifications and performance data for selected values.
Check MySQL Replication Slave Status
Checks if MySQL Replication is active, checks for delay and outputs some additional info and performance data. It also catches non-obvious errors which would indicate a working replication, although there is something broken.
Check MS SQL 2008 / 2012 Used Memory
 This tool is written in Python and it uses Windows Performance Counters to get the MS SQL memory usage. Using the Perfmon counters makes it so that a SQL account isn't required.

 Directory
 New Listings