
Search Exchange
Search All Sites
Nagios Live Webinars
Let our experts show you how Nagios can help your organization.Login
 New Listings
Directory Tree
Directory
Search Results
The search results below show both sub-categories and individual listings that match your search criteria.
Meet The New Nagios Core Services Platform
Built on over 25 years of monitoring experience, the Nagios Core Services Platform provides insightful monitoring dashboards, time-saving monitoring wizards, and unmatched ease of use. Use it for free indefinitely.
Monitoring Made Magically Better
- Nagios Core on Overdrive
- Powerful Monitoring Dashboards
- Time-Saving Configuration Wizards
- Open Source Powered Monitoring On Steroids
- And So Much More!
Submit Your Nagios Project!
Help build Nagios Exchange for yourself and the entire the Nagios Community by your Nagios project to the site. It's easy - just create an account, login, and add a new listing. Read the FAQ for instructions.check_cputime
 This is a plugin designed using Bash script.
This plugin is created so that 'Performance Gauges' in Nagios XI work properly, showing appropriate 'Warning' and 'Critical' regions.
This is a plugin designed using Bash script.
This plugin is created so that 'Performance Gauges' in Nagios XI work properly, showing appropriate 'Warning' and 'Critical' regions.
check_cpu.sh
This shell script checks cpu utilization (user,system,iowait,idle in %) with iostat accepting seperate threshholds and returning the data in a format suitable for performance data processing
check_cpu.py for Linux
 Simple python based monitoring plugin to check the cpu usage (system, user, nice, iowait, irq, softirq, idle, steal, guest, guest_steal) of a linux server. Warning/Critical thresholds and performance data output are supported.
check_couchdb
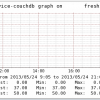 A python based check for CouchDB Databases. Checks for reachability, login and performance data. Supports HTTP and HTTPS servers.
MongoDB and similar should work as well.
A python based check for CouchDB Databases. Checks for reachability, login and performance data. Supports HTTP and HTTPS servers.
MongoDB and similar should work as well.
check_container_memory
This plugin checks the docker container internal memory usage, it retrieves the values using docker stats. The plugin outputs also the performance data.
check_container_cpu
This plugin checks the docker container internal CPU usage, it retrieves the values using docker stats. The plugin outputs also the performance data.
check_cnc
ControlNCloud Nagios plugin for hybrid monitoring. Connect your Nagios to our free internet services and monitor performance and disponibility of your websites. It's simple, you just have to: - Set up sites to monitor from our website after creati ...
check_cisco_ports_bandwidth
1) Scan network interfaces of a Cisco Switch 2) Measure average bitrate from last measurement for all ports or one interface 3) Display peak bitrate and the port associated with it with warning and critical thresholds 4) Produce performance data for al ...
check_cisco_nexus_mem
This plug-in gives memory usage (free and used) of Cisco Nexus datacenter switches. Performance data are also given.
check_cisco_nexus_hardware
This plug-in checks a collection of sensors included on Cisco Nexus. It checks voltage, temperature, fans and PSU. Performance data are also given.
check_cisco_nexus_cpu
This plug-in gives CPU usage (in %) on 5 seconds, 1 minute and 5 minutes average. Performance data are also given. It has been successfully tested on Cisco Nexus 7000 and 5000.
check_cassandra_cluster.sh
* Software requirements cassandra(using nodetool) * overview - verify that the number of live nodes which belong to Multi Cluster is less than the specified number. - it is enable to specify the threshold with "-w " and "-c " option. - fetch the nu ...
check_bind.sh
 sh compliant script to check whether BIND is running and to get the performance data via rndc stats (PNP Template included)
check_bbstore
Check usage of a Box Backup store account and reports all values as performance data.
check_avail_memory
This script checks the available memory on a Linux system, it prints out the performance data too.
check_asterisk_odbc_cdr_row_count
This plugin checks total Asterisk ODBC CDR records via isql. The number of CDR records is returned as performance data.
check_asterisk_channels
This plugin checks an asterisk server for active channels and calls, and issues alerts if any defined thresholds are exceeded. Performance data is also returned for both active channels and calls.
check_arp_ping.sh
NAGIOS plugin to perform an arping check for hosts that block ping (use case: monitoring Alexa/Echo Dots). The message output and performance metrics exactly mirrors the standard check_ping plugin, for seamless replacement operation :)
check_apcupsd_v1_3 (performance data output added)
check_apcupsd v1.2 is now v1.3 (performance data output added)
check_apachestatus with performance data
Enhanced version of Lieven De Bodt's check_apachestatus.pl that produces correct performance data for PNP. Requests/sec, kB/sec and kB/Request were added to the output. Bugfix 20080930: When Apache reported "nnn B/sec" instead of "nnn kB/sec", plugin fail ...


