
Search Exchange
Search All Sites
Nagios Live Webinars
Let our experts show you how Nagios can help your organization.Login
 New Listings
Directory Tree
Directory
Search Results
The search results below show both sub-categories and individual listings that match your search criteria.
Meet The New Nagios Core Services Platform
Built on over 25 years of monitoring experience, the Nagios Core Services Platform provides insightful monitoring dashboards, time-saving monitoring wizards, and unmatched ease of use. Use it for free indefinitely.
Monitoring Made Magically Better
- Nagios Core on Overdrive
- Powerful Monitoring Dashboards
- Time-Saving Configuration Wizards
- Open Source Powered Monitoring On Steroids
- And So Much More!
Submit Your Nagios Project!
Help build Nagios Exchange for yourself and the entire the Nagios Community by your Nagios project to the site. It's easy - just create an account, login, and add a new listing. Read the FAQ for instructions.Check Microsoft Windows Scheduled Tasks
 Checks Microsoft Windows 2008 or higher enabled scheduled tasks excluding or including defined folders, task patterns and authors, returning state of tasks with name, author, exit code, last runtime and performance data to Nagios.
Check Microsoft Windows Disk Load
Check MS Windows disk load by using this Powershell script to get all disk load related counters from Windows Performance Manager, computing averages for all gathered samples and calculating read / write rate, number of reads / writes, read / write latenc ...
Check Linux Process
Checks Linux process count, CPU and memory usage and produce relevant exit code and performance data to Nagios.
Check Linux CPU, Process Scheduler and I/O Stats (chec...
This plugin provides data on CPU Utilization and Linux Schedule by reading /proc/stat parses all data into performance variables. Warning and critical alerts can be issued if CPU Utilization is high.
Check IBM Storwize V7000 Unified / SONAS Performance
This bash script reports on various performance metrics of an IBM Storwize V7000 Unified / SONAS system, using the 'lsperfdata' CLI command.
Check Hyperv Performance
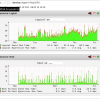 Plugin to Show Hyper-V Performance. This breaks stats down for each guest compared to the host.
* Guest CPU
* Guest Healthy Count
* Guest Network Usage
* Guest Storage Performance
* Host CPU
Plugin uses NSClient++
Plugin to Show Hyper-V Performance. This breaks stats down for each guest compared to the host.
* Guest CPU
* Guest Healthy Count
* Guest Network Usage
* Guest Storage Performance
* Host CPU
Plugin uses NSClient++
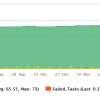
Check Hyper-V 2012 health - BPA & VM
Check Hyper-V health through NRPE by: -Executing and retrieving BPA Results -Checking not running VM -Checking not operational normally VM Warning and Critical state are triggered on sum of: -Number of BPA issues -Number of VM in bad shape You ...
Check HTTP with JSON performance data
Check HTTP with JSON performance data Performs a basic HTTP check, parses the body as JSON and returns it as performance data. The response time is also returned as performance data. As an added bonus, the warning and critical threshold can be set o ...
Check HP MSA P2000
This checks the HP P2000 for the status of all parts within the SAN, this includes all Enclosures, Fans, Voltages, Disks and Temperatures. SNMP is not needed for this as it uses the inbuilt API to gather the status and performance counters over HTTP or HT ...
Check HaProxy Configuration
This plugin checks the haproxy.cfg syntax and dead members. It will also issues either a Warning or Critical alert with performance stats of file size change. A Critical Alert will indicate the HaProxy will NOT startup if a "service haproxy restart" was i ...
Check Fortigate Status
This script is a modification of "Check Fortigate CPU load" (or check_fortigate_cpu.pl). I have modified it to work with our models (200A and 80C). Perhaps someone will find it useful. It works for CPU and RAM usage, as well as active sessions. ...
Check form
Check form allows the user to submit forms using post and test the output for a string. This can be useful to test authentication boxes or any other forms that use the POST method. Check form can also test the response time of the form and produce timing ...
Check Flexlm Usage
Generate performance data about a specific feature of a flexlm license via lmutil
check EdgeRouter 6p
This script allows you to monitor the Ubiquiti Networks EdgeRouter 6P load, network, and disk space. At the moment only the disk space has warning and critical data, the other ones are just monitor scripts that allow me to see performance data graphics. ...
Check drives fragmentation status
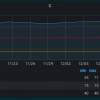 Check Windows disks fragmentation status and optionally performs defragmentation. It returns performance counters for each drive.
Check Diskspace Used by a Mounted Volume
This plugin is designed using Bash script and intended to display the disk space used by the specified mount point or partition or volume. This plugin is created so that 'Performance Gauges' in Nagios XI work properly, showing appropriate 'Warnin ...
Check Dell MD Performance
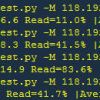 check the Dell MD series Storage performance, now can monitor the average IOPS, average MB/s and Read %. Check on the MD3820i
Check DataDomain
This perl script will monitor Datadomain High-Speed Inline Deduplication Storage Systems and provide "groundwork" like performance data.
Check CPU Usage via SNMP
 Shell script to check cpu usage via SNMP.
My environment need check overall CPU usage under Linux/Windows system via SNMP (not require NRPE plugin).
Complete with performance data report (can display using pnp system)
Shell script to check cpu usage via SNMP.
My environment need check overall CPU usage under Linux/Windows system via SNMP (not require NRPE plugin).
Complete with performance data report (can display using pnp system)


