
Search Exchange
Search All Sites
Nagios Live Webinars
Let our experts show you how Nagios can help your organization.Login
 New Listings
Directory Tree
Directory
nagiospig
Check the status of DELL PowerEdge server Popular
 This plugin can check the status of DELL PowerEdge server using SNMP v1 queries and Dell OpenManage.
Nagios Status Information (NSI)
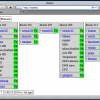
![]() NSI is a PHP interface with an user management system, where an admin can give users acces to only some monitored hosts, that implements the Nagios status file and shows a simple overview of the available hosts and their status.
NSI is a PHP interface with an user management system, where an admin can give users acces to only some monitored hosts, that implements the Nagios status file and shows a simple overview of the available hosts and their status.
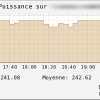
check_traffic_limit
 check_traffic_limit is a Nagios plugin based on vnstat. It checks the traffic on any interface and sends a warning when defined daily or monthly limits are reached. The plugin comes with Nagios grapher templates.
Example:
check_traffic_limit_0.2 -i et ...
check_traffic_limit is a Nagios plugin based on vnstat. It checks the traffic on any interface and sends a warning when defined daily or monthly limits are reached. The plugin comes with Nagios grapher templates.
Example:
check_traffic_limit_0.2 -i et ...
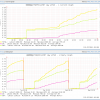
check_mysql_counters
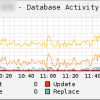 Graphs a large selection of mysql counters for visualizing database performance. Not an alerting plugin - merely collects data. Requires pnp4nagios.
Sam Weather 2.0
 Weather plugin for Nagios that lets you check temperature, humidity, wind, rain fall, dewpoint, heat index, windchill, pressure, solar radiation, and UV index. This also reports performance data to Nagios for graphing. The plugin uses data from Weather ...
RealOpInsight
 RealOpinsight is a business service monitoring tool that enables you to manage your IT while focusing on the services you provide.
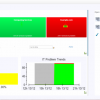
Highcharts for Nagios
 Highcharts for Nagios offering good-looking interactive charts to you.
Zooming can be in the X or Y dimension, or both.
It can show/hide different data series and auto adjust X, Y axis.
You can directly export the chart to PNG, JPG, PDF or SVG format.
Highcharts for Nagios offering good-looking interactive charts to you.
Zooming can be in the X or Y dimension, or both.
It can show/hide different data series and auto adjust X, Y axis.
You can directly export the chart to PNG, JPG, PDF or SVG format.
check_DiskQueueLength
 This plug-in for Nagios allows you to check the Average Disk Queue Length on a Windows server. The measurement of Average Disk Queue Length is quite accurate.
Nagrestconf
 Nagrestconf is a mature and well maintained REST interface and configuration GUI for Nagios. Easy to install with docker. Easy querying and modification from the command line using Nrcq.
check_defrag
 This plug-in for Nagios allows you to check if a disk needs to be defragmented.
Modified Nsclient Agent - Top 5 CPU & Memory Consuming...
 Modified Nsclient++ v1.0 Agent and Modified check_nt(nagios-plugins) for windows servers to get Top 5 CPU or Memory consuming process details right inside your Nagios.
nagios fail over
nagios-failover script to failover nagios servers if and when their down - automtically done via bash script that will require some ground work to be done in order to achieve the end result of each nagios server looking out for one another. I have a ...
Nagios Availability Reports to pdf
 Nagios Availability Reports to pdf via wkhtmltopdf and crontab
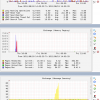
CPU Stats/Memory Used Plugin - Top 5 CPU/Memory Consumi...
 Returns the CPU Stats & Memory Used for all unix servers (tested on HPUX, should work on all), with Top 5 CPU or Memory consuming process details like ProcessID, ProcessName, CPU% or MemKB(used). Very useful when you got an alert from Nagios or an integra ...
sgichk_cuda_chassis
 Check Chassis/environmental stats for a Barracuda Spam Firewall. Also has a custom pnp4nagios graph template for it.
MSSQL Job History
 This is a simple script because I saw the idea of monitoring failed jobs at http://exchange.nagios.org/directory/Plugins/Databases/SQLServer/Check-MSSQL-Server-Centric-Status/details however I really didn't want to implement an unnecessarily complex, mult ...
countdown_to_date
![]() The purpose of this plugin is to allow you to trigger warning or critical states as you approach a date. This date might be the warranty expiry date on a server, or when a license needs renewing.
The purpose of this plugin is to allow you to trigger warning or critical states as you approach a date. This date might be the warranty expiry date on a server, or when a license needs renewing.
check_cmusage
![]() check_cmusage is a perl plugin
This plugin is for LINUX edition. Computing cpu and mem usage. You need basic perl package to run this plugin.
Usage: check_cmusage
-C # CPU, Memory Warning value;
-W # CPU, Memory Critica ...
check_cmusage is a perl plugin
This plugin is for LINUX edition. Computing cpu and mem usage. You need basic perl package to run this plugin.
Usage: check_cmusage
-C # CPU, Memory Warning value;
-W # CPU, Memory Critica ...
Balbec
 Balbec is a lightweigth python application which displays nagios data in a browser or produces xml for further processing.
Windows User logged-in check
![]() This plugin allow to easily check how much users are logged-on a windows machine with SNMP enabled , no Agent needed.
in the .tar you can find everything needed to make this running in a minute :)
This plugin allow to easily check how much users are logged-on a windows machine with SNMP enabled , no Agent needed.
in the .tar you can find everything needed to make this running in a minute :)
check_diskstat
![]() Linux disk IO check. Reads /sys filesystem directly to query tps, read, write, avg. request size, avg. queue size and avg. wait time.
Linux disk IO check. Reads /sys filesystem directly to query tps, read, write, avg. request size, avg. queue size and avg. wait time.
TCP traffic degradation detection from link utilization
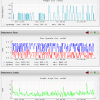
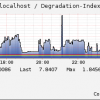 This plugin estimates the TCP traffic performance degradation from coarse link utilization traces, such as those obtainable by SNMP.
check_bad_apache_procs.sh
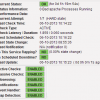 This is a simple BASH script that checks that only the correct Apache processes are running, and that no other processes (such as PERL scripts) are running as Apache.
If it returns OK, it includes the text "0 Bad apache Processes Running". If it fails ...
This is a simple BASH script that checks that only the correct Apache processes are running, and that no other processes (such as PERL scripts) are running as Apache.
If it returns OK, it includes the text "0 Bad apache Processes Running". If it fails ...
check_netbotz
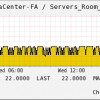 This python plugin will check NetBotz200 temperature and humidity sensor,and return the results. In addition, it produces performance data.
check_switch_module
![]() Check that modules are in an ok state. Say exactly which module is in non-ok state otherwise. Tested on Cisco Nexus 7000 series switches.
Check that modules are in an ok state. Say exactly which module is in non-ok state otherwise. Tested on Cisco Nexus 7000 series switches.
Verizon FiOS Bandwidth Check
Logs into Verizon FiOS router via telnet and pulls back bandwidth usage information.
Exchange 2013 Server Health
![]() Exchange 2013 Server Health/Component Health Check for Nagios and use with NSClient/NRPE.
Exchange 2013 Server Health/Component Health Check for Nagios and use with NSClient/NRPE.
Exchange 2010 Performance Counters
 Here are several scripts I put together to monitor various exchange 2010 performance counters. Activesync, Memory, Database, RPC, Message Queue, Throttling counters. A good start for getting a handle on Exchange 2010. Hope people can find this useful. ...


