
Search Exchange
Search All Sites
Nagios Live Webinars
Let our experts show you how Nagios can help your organization.Login
 New Listings
Directory Tree
Directory
Search Results
The search results below show both sub-categories and individual listings that match your search criteria.
Meet The New Nagios Core Services Platform
Built on over 25 years of monitoring experience, the Nagios Core Services Platform provides insightful monitoring dashboards, time-saving monitoring wizards, and unmatched ease of use. Use it for free indefinitely.
Monitoring Made Magically Better
- Nagios Core on Overdrive
- Powerful Monitoring Dashboards
- Time-Saving Configuration Wizards
- Open Source Powered Monitoring On Steroids
- And So Much More!
Submit Your Nagios Project!
Help build Nagios Exchange for yourself and the entire the Nagios Community by your Nagios project to the site. It's easy - just create an account, login, and add a new listing. Read the FAQ for instructions.iNag2
 iNag2 is the encore to the award wining app used by thousands of network administrators around the world.
• Process information and control
• Available Push Alerts
• Host and Service grouping.
• Comments viewable for both Host and Services. ...
iNag2 is the encore to the award wining app used by thousands of network administrators around the world.
• Process information and control
• Available Push Alerts
• Host and Service grouping.
• Comments viewable for both Host and Services. ...
Icon Set Generator
This script automates the process of generation the nessessary image formats for Nagios: The script takes a GIF file as an argument (or *.gif) and generates image files in JPEG, PNG and GD2 formats.
html form
html_form.pl - Authenticate a web page by filling in a form using browser emulation allowing javascript and cookies to be processed. This script fills in the username and password boxes within a form and then searches the output for an expected string. ...
HP Lefthand Volume Size check
This script, building upon the existing https://exchange.nagios.org/directory/Plugins/Hardware/Storage-Systems/SAN-and-NAS/HP-Lefthand-P4000-Cluster-Volume-check/details plugin checks individual volumes and returns a percentage used. A small amount of wo ...
HP 3PAR Storage Monitor - Health Check
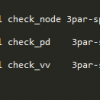 Perl script uses Expect to login to 3par service processor via ssh.
There is no additional software required. Can be used for nagios, op5, etc. monitoring.
Perl script uses Expect to login to 3par service processor via ssh.
There is no additional software required. Can be used for nagios, op5, etc. monitoring.
Host-Resource-MIB queries (cpu, processes, storage)
Query the Host Resource MIB of various operating systems for cpu usage, processes and storage/volumes. These scripts have been tested against Linux and Windows XP, but should do the job for any other OS as well.
High throughput NCSA replacement
NCSA replacement capable or processing thousands of service check results per second
FireMotD
 Generate a dynamic MotD (Message of the Day) which displays system information after logging into a Linux server.. For example IP, Release, Kernel, Platform, Uptime, CPU Utilisation and Load, Memory, Swap, Disk information, the number of yum / apt-get / z ...
Exporting the XI Configuration Database
This guide takes you through the process of manually exporting the Nagios XI configuration database and checking for errors that need resolution. Manual exports are useful when debugging configuration errors - including the failure of XI to apply a new co ...
example processing service performance data
A script to store performance data in rrdtool databases written in perl.
EMC Unity
### check_unity.py ### This is a Nagios monitoring script for DELL EMC Unity storage box. [root@]# ./check_unity2.py -H myunitybox.foo.com -u monituser -p monitpass -m usage: check_unity2.py [-h] -H HOSTADDRESS -u USER -p PASSWORD -m ...
EMC CLARiiON Monitoring Wizard
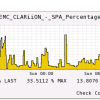 This Wizard allows you to monitor an EMC CLARiiON SAN. You can monitor the following components of the SAN: * Storage Processors = Status of each SP * Storage Processors Information = Gets information on the SP (SP ID, Agent Revision, FLARE Revision, PRO ...
eDirectory driver status
This plugin will accept a driver name as an argument, and will check its status. If it's not running, it will trigger alerts. It will also trigger warnings if the unprocessed cache is over a specified limit.
easyNag for iPhone & iPad
 easyNag is the most innovative, fastest and simplest app to interact with your Nagios, Icinga, OP5 Monitor, OpsView, Thruk/Naemon, Centreon or Check_MK monitoring system.
Setup is easy - just add a new instance with the URL to your monitoring system, y ...
easyNag is the most innovative, fastest and simplest app to interact with your Nagios, Icinga, OP5 Monitor, OpsView, Thruk/Naemon, Centreon or Check_MK monitoring system.
Setup is easy - just add a new instance with the URL to your monitoring system, y ...
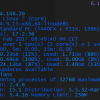
CPU Stats/Memory Used Plugin - Top 5 CPU/Memory Consumi...
 Returns the CPU Stats & Memory Used for all unix servers (tested on HPUX, should work on all), with Top 5 CPU or Memory consuming process details like ProcessID, ProcessName, CPU% or MemKB(used). Very useful when you got an alert from Nagios or an integra ...
cperf
This is a plugin that monitors CPU, memory and swap utilization related. It can monitor cpu and memory for more complex output with swap analysis and blocked processes, alarming as critical only in cases where paging and locked processes exist.
Count a running process number
You can count any process, and you can add warning & critical thresholds, both low and high. For example: $ check_ps_count.sh -p bind OK: bind found 1 time
Configuring Passive Services With XI
This document describes how to configure passive service checks in Nagios XI. Passive checks are useful when you want to receive and process data (such as security alerts and log events) from external applications.
Complete CPU and Memory check for UNIX - cperf.sh
This is a plugin that monitors CPU, memory and swap utilization related. It can monitor cpu and memory for more complex output with swap analysis and blocked processes, alarming as critical only in cases where paging and locked processes exist. This scr ...
Cloudviewer (for VMWare vCenter)
 Check_MK like Plugin for VMware vCenter.
Splitted in two parts:
cloudviewer-reloader.pl:
Reads all Clusters,Hosts,VMs and Datastores from the given VC and creates Nagios Objects for it. This has to be run as a cronjob.
cloudviewer.pl:
Reads you ...
Check_MK like Plugin for VMware vCenter.
Splitted in two parts:
cloudviewer-reloader.pl:
Reads all Clusters,Hosts,VMs and Datastores from the given VC and creates Nagios Objects for it. This has to be run as a cronjob.
cloudviewer.pl:
Reads you ...


