
Search Exchange
Search All Sites
Nagios Live Webinars
Let our experts show you how Nagios can help your organization.Login
 New Listings
Directory Tree
Directory
Search Results
The search results below show both sub-categories and individual listings that match your search criteria.
Meet The New Nagios Core Services Platform
Built on over 25 years of monitoring experience, the Nagios Core Services Platform provides insightful monitoring dashboards, time-saving monitoring wizards, and unmatched ease of use. Use it for free indefinitely.
Monitoring Made Magically Better
- Nagios Core on Overdrive
- Powerful Monitoring Dashboards
- Time-Saving Configuration Wizards
- Open Source Powered Monitoring On Steroids
- And So Much More!
Submit Your Nagios Project!
Help build Nagios Exchange for yourself and the entire the Nagios Community by your Nagios project to the site. It's easy - just create an account, login, and add a new listing. Read the FAQ for instructions.check_traffic.sh
This plugin checks traffic usage and jitter of: 1) a single interface on a single network device 2) multiple interfaces on a single network device 3) interface(s) on a single or multiple network devices The amount of interfaces is not limited. How ...
check_toner
This plugin will check the black toner level on a printer via SNMP.
check_synology_status
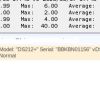 This check checks the status of the NAS, fan status (system and CPU) and system temperature. Additionally described model, serial number and version of DSM. Connection via SNMP
example:
check_synology_status public 2c 192.168.1.30
This check checks the status of the NAS, fan status (system and CPU) and system temperature. Additionally described model, serial number and version of DSM. Connection via SNMP
example:
check_synology_status public 2c 192.168.1.30
check_supermicro_superdoctor
Uses SNMP to interrogate SuperDoctor and reports the state. Built out of my desire for check_openmanage, but for some SuperMicro hardware that we have laying around
check_stpblock.pl
This plugin will do a snmp scan on a switch and retrieve all spanningtree blocked ports. If you specify --warning or --critical values, the plugin will exit if it finds more blocked ports. Default is 0 for both warning and critical.
check_starface.pl
A nagios check plugin for Starface Appliances. You can call it on your Starface via ssh or by SNMP
check_stack_netgear.sh
Check stack status of Netgear switches (Count in SNMP the physical number of units in the stack)
check_snmp_wlc_ap
Nagios check in python review the number of APs associated to a Cisco Wlan Controller using snmp and trigger alarms if less than critical or warning threshold.
check_snmp_vmfs.sh
This shell script uses the output of the "vdf" command (published via snmp to avoid check_by_ssh or NRPE) to determine the free space of a given vmfs volume as measured in GB.
check_snmp_uptime
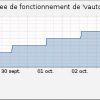 This plugin can check the uptime of a host using SNMP v1 queries.
check_snmp_unicast
Unicast Utilization Statistics plugin for Nagios
check_snmp_traffic_total
This is a nagios plugin to check the total amount of traffic passing within a defined time period.
check_snmp_traffic
Check traffic usage of an interface Usage: ./check_snmp_traffic # ./check_snmp_traffic localhost private 1 ">1" ">2" WARNING if iface # 1 trafic > 1 Mbit/s, CRITICAL if trafic > 2 Mbit/s # ./check_snmp_traffic localhost private 10 "
check_snmp_temps_proliant
Checks the temperatures of any Proliant Hardware. No need to have 10s of plugins.
check_snmp_temperature
General temperature check plugin - supports dell, hp, cisco, juniper, alteon. Other types can be specified easily if you know temperature SNMP OIDs. Data can also be returned as performance values for graphing or other processing.
check_snmp_table
Retrieves an SNMP MIB Object table. The resulting table is formatted as performance data which can be used by external components to generate graphs, charts, etc. Very flexible. Also stores the table in JSON and PHP-serialized formats. Plugin is writte ...
check_snmp_suse_disk.sh
this shell runs on nagios server, it checks suse os disk usage by snmp protocol,it supports checking SUSE10.1/SUSE10.2/SUSE10.3/SUSE11.1/SUSE11.2


