
Search Exchange
Search All Sites
Nagios Live Webinars
Let our experts show you how Nagios can help your organization.Login
 New Listings
Directory Tree
Directory
Search Results
The search results below show both sub-categories and individual listings that match your search criteria.
Meet The New Nagios Core Services Platform
Built on over 25 years of monitoring experience, the Nagios Core Services Platform provides insightful monitoring dashboards, time-saving monitoring wizards, and unmatched ease of use. Use it for free indefinitely.
Monitoring Made Magically Better
- Nagios Core on Overdrive
- Powerful Monitoring Dashboards
- Time-Saving Configuration Wizards
- Open Source Powered Monitoring On Steroids
- And So Much More!
Submit Your Nagios Project!
Help build Nagios Exchange for yourself and the entire the Nagios Community by your Nagios project to the site. It's easy - just create an account, login, and add a new listing. Read the FAQ for instructions.f_logos
 These are logos and pictures of vendor logos and other things that I found useful to represent a monitored system.
FTP Server Nagios XI Monitoring Wizard
![]() A Nagios XI monitoring wizard that makes it easy to monitor login and file transfer capabilities of an FTP server
A Nagios XI monitoring wizard that makes it easy to monitor login and file transfer capabilities of an FTP server
FireMotD
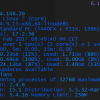 Generate a dynamic MotD (Message of the Day) which displays system information after logging into a Linux server.. For example IP, Release, Kernel, Platform, Uptime, CPU Utilisation and Load, Memory, Swap, Disk information, the number of yum / apt-get / z ...
Failed logins last hour
This is a plugin to monitor failed login attempts in RedHat/CentOS servers.
Exporting Data in Log Server 2
Now that you've configured log collection and queries, learn how to export data using this new feature in Log Server.
Execute a remote command via SSH
This action can be added into Nagios Reactor to log into a remote machine via SSH and issue a command.
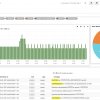
Exchange 2010/2013 Message Tracking Logs
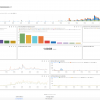 This dashboard monitors the Message Tracking Logs in Exchange 2010 onwards.
I can't take credit for developing this, I just adapted it for NLS - Original creator here: https://elijahpaul.co.uk/analysing-exchange-2013-message-tracking-logs-using-elk-ela ...
This dashboard monitors the Message Tracking Logs in Exchange 2010 onwards.
I can't take credit for developing this, I just adapted it for NLS - Original creator here: https://elijahpaul.co.uk/analysing-exchange-2013-message-tracking-logs-using-elk-ela ...
Exchange 2010 CAS
Exchange Client Access Checks for 2010 These use the inbuilt test functionality in Exchange through the Exchange Management Shell. These tests log in using the test cas users to the various servers and actually test functionality AND response. So it wi ...
Eventlog Checker - dotNET Based
Checks a specified Windows Eventlog for any specified event types. Supports filtering, searching for event type ids, etc. This requires at least the .NET 1.1 Framework to be installed on the serve
ESXI Dell perc HDD/SDD S.M.A.R.T. check
Linux plugin that uses ssh to remotely login on ESXi hosts and check the S.M.A.R.T. on all HDDs/SSDs for this controller
Environmental monitoring with BME680
Environmental monitoring with Raspberry Pi and BME680 and Nagios / NRPE Python3 script run by NRPE. Assumes the BME680 device is already attached to the Raspberry Pi. Software setup Install the required library: sudo pip3 install adafruit- ...
Enhanced Windows eventlog check
Advanced options for filtering and alerting on eventlog events. *requires .NET 2.0 to work
Energy waste manager
 Service checks and sends alert to one or more contacts telling which computer network objects are active. This information will be forwarded via e-mail containing the number of objects connected in moments of data unnecessarily. Faced with this informatio ...
EMC CLARiiON Monitoring Wizard
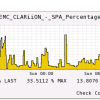 This Wizard allows you to monitor an EMC CLARiiON SAN. You can monitor the following components of the SAN: * Storage Processors = Status of each SP * Storage Processors Information = Gets information on the SP (SP ID, Agent Revision, FLARE Revision, PRO ...
easyNag for iPhone & iPad
 easyNag is the most innovative, fastest and simplest app to interact with your Nagios, Icinga, OP5 Monitor, OpsView, Thruk/Naemon, Centreon or Check_MK monitoring system.
Setup is easy - just add a new instance with the URL to your monitoring system, y ...
easyNag is the most innovative, fastest and simplest app to interact with your Nagios, Icinga, OP5 Monitor, OpsView, Thruk/Naemon, Centreon or Check_MK monitoring system.
Setup is easy - just add a new instance with the URL to your monitoring system, y ...
ds18b20
Written in C, ds18b20 can locate all ds18b20 probes connected to the system (Raspberry PI) via the GPIO pins and either run as a daemon and log temperatures to logfiles or run as a nagios check via nrpe.
Disabled host and service notification parser - updated...
This is an updated version of an all in one script that does a little bit more than original project: http://exchange.nagios.org/directory/Addons/Notifications/*-Notification-Managers/Disabled-host-and-service-notification-parser/details Script looks ...
DHCP Messages
 A custom dashboard to give a breakdown on the different DHCP Messages. This has a query filter where the type must be syslog and the program must be dhcpd.
DFSR Replication and BackLog
Check DFS Replication and DFS Backlog Powershell


