
Search Exchange
Search All Sites
Nagios Live Webinars
Let our experts show you how Nagios can help your organization.Login
 New Listings
Directory Tree
Directory
Search Results
The search results below show both sub-categories and individual listings that match your search criteria.
Meet The New Nagios Core Services Platform
Built on over 25 years of monitoring experience, the Nagios Core Services Platform provides insightful monitoring dashboards, time-saving monitoring wizards, and unmatched ease of use. Use it for free indefinitely.
Monitoring Made Magically Better
- Nagios Core on Overdrive
- Powerful Monitoring Dashboards
- Time-Saving Configuration Wizards
- Open Source Powered Monitoring On Steroids
- And So Much More!
Submit Your Nagios Project!
Help build Nagios Exchange for yourself and the entire the Nagios Community by your Nagios project to the site. It's easy - just create an account, login, and add a new listing. Read the FAQ for instructions.Debian upgrades
This plugin updates Debian apt database, then checks for available upgrades to install. Set WARNING if upgrades are available, OK otherwise (nothing to upgrade). Useful to be warned when security updates are available for your system.
Dealing with SELinux in Nagios
This article describes a pretty common scenario - SELinux creates problems with your Nagios install and you have to deal with it. Most people prefer to disable SELinux in their environments and this is the approach I would personally take.
DBTuna Database Performance Monitor Plugin
DBTuna is a 24x7 database performance monitoring tool which collects deep dive performance information from Oracle, SQL Server and MySQL. This plugin allows you to integrate DBTuna data with Nagios and run checks on database Activity, Wait Events or Stati ...
db2-jnrpe
 Innovative set of plugins to monitor DB2 databases written in Java to be executed from JNRPE.
With less overhead on your database, it provides a more accurate information about what is currently happening in your databases.
Innovative set of plugins to monitor DB2 databases written in Java to be executed from JNRPE.
With less overhead on your database, it provides a more accurate information about what is currently happening in your databases.
Day of week equals
Context variables are used to pass dynamic information to event chains. The "Day of week equals" condition returns true if the date in which the chain was run lands on the selected day. Install/update condition through Administration -> Conditions
David Thomas - Know Its Broke Before Your Customers Do
How can your company or organization monitor, track and keep you notified of "anything and everything" that might go wrong in your network while maintaining your change management database? This can be done no matter what your budget constraints or requir ...
Dave Williams - Nagios In The Real World - The Datacent...
A description of a real-world implementation of Nagios and it's numerous add-ons that monitors & reports on a Tier-3 datacentre and all of the mechanical & electrical plant that a datacentre needs. Use of Nagvis, SNMPTT, dbevent, nsca & nrpe. Description ...
Database Monitoring with Nagios
![]() Database Monitoring with Nagios is a article with links to a collection of database monitoring plugins and descriptions of monitoring methods.
Database Monitoring with Nagios is a article with links to a collection of database monitoring plugins and descriptions of monitoring methods.
Database Access For Development Purposes
Nagios XI comes as a ready to go monitoring system delivered as a virtual machine (VM). I have spent a bit of time developing Configuration Wizards, Components and Dashlets for Nagios XI and during this time I have needed to look at the backend databases ...
Data Recovery Download
www.datarecoverydownload.net website recommends Data recovery download software restores lost files and folder from usb drive without wasting time and valuable money. Data recovery software revives corrupted text documents damaged due to human mistake, lo ...
Dashboard Deployment XI Component
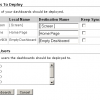 This Nagios XI component allows admins to deploy one or more of their own dashboards to other users. This can be useful when you design a dashboard that other users may want access to. Includes the ability to keep user's dashboards synchronized with the ...
Dashboard 0.2.1 - Python
Python based Dashboard that allows user based dashboards with custom grouping of items. Works with both Nagios and Nagios under Groundwork.
DashBoard
DashBoard allows you to create custom pages (create & edit on-the-fly) with service and host status monitoring for every user separately. You can create groups and subgroups so you can view all necessary information in just one page.
Daniel Wittenberg - Scaling Nagios At A Giant Insurance...
This presentations covers all aspects of Nagios needed to scale to a large environment with over 35,000 devices and 1.4 million service checks. It discuses the hardware, operating system, Nagios Core, plugins, and configurations that you can use in a larg ...
D7SMS for Nagios
 Nagios SMS notification via D7SMS allows to send worldwide SMS notifications for each hosts and services. For FREE sms credits signup at https://d7networks.com. This script used Nagios pager configuration and a python script for sending SMS notificatio ...
CyberPower UPS
Based on the APC UPS check, this plugin has been modified to work with CyberPower UPS systems.
cwas-nagios
Nagios plugins, to monitoring websphere internals, using perfservlet.
custom_mail_alert.pl
A hook script called by the check_logfiles plugin to send custom mail alerts. This is useful in case you want to send custom output in addition [or instead] of the one Nagios itself sends. I originally wrote it to send custom mails to customers when an ...
Customizing The Nagios XI Landing Page
This document describes how to customize the landing page that users see when they initially login to the Nagios® XI™ web interface. One of the benefits of Nagios XI is the flexibility to customize the information users see in the web interface. Custom ...
Custom Logo XI Component
This component allows admins to specify a custom logo and URL in the header of the Nagios XI interface. Useful for co-branding or custom branding of the monitoring app.


