
Search Exchange
Search All Sites
Nagios Live Webinars
Let our experts show you how Nagios can help your organization.Login
 New Listings
Directory Tree
Directory
Search Results
The search results below show both sub-categories and individual listings that match your search criteria.
Meet The New Nagios Core Services Platform
Built on over 25 years of monitoring experience, the Nagios Core Services Platform provides insightful monitoring dashboards, time-saving monitoring wizards, and unmatched ease of use. Use it for free indefinitely.
Monitoring Made Magically Better
- Nagios Core on Overdrive
- Powerful Monitoring Dashboards
- Time-Saving Configuration Wizards
- Open Source Powered Monitoring On Steroids
- And So Much More!
Submit Your Nagios Project!
Help build Nagios Exchange for yourself and the entire the Nagios Community by your Nagios project to the site. It's easy - just create an account, login, and add a new listing. Read the FAQ for instructions.Wlsagent
Wlsagent is a Nagios plugin which aims to provide JMX monitoring capabilities for WebLogic servers (9 & 10), whith the smallest possible memory footprint. Monitoring is achieved with simple HTTP requests, through the use of an embedded Jetty container. ...
Wisvia for Nagios - notifications to mobile apps
Push Notification to mobiles for Nagios
WINSMS
This Script Allow you to send a sms via external API without Plugging in a GSM or Modem using Winsms
Windows Updates Dashboard
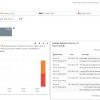 The following dashboard shows you how many total Windows Updates are
pending in the pipe, as well as the most recently installed updates. The
query filters for EventID 17 (pending) and 19 (installed). The dashboard
has two trimmed tables for the most r ...
The following dashboard shows you how many total Windows Updates are
pending in the pipe, as well as the most recently installed updates. The
query filters for EventID 17 (pending) and 19 (installed). The dashboard
has two trimmed tables for the most r ...
Windows updates
Very, very primitive check for checking windows updates. It never return "CRITICAL" status. It return only: 1) OK - if no updates. 2) WARNING - if updates present. Of course, Windows updates must be configured with option "Download, but not install". ...
Windows Server Monitoring Wizard
![]() This Nagios XI wizard allows you to easily monitor a Microsoft® Windows 2000, 2003, or 2008 server. Allows you to monitor CPU, memory, disk usage, services, processes, and performance counters.
This Nagios XI wizard allows you to easily monitor a Microsoft® Windows 2000, 2003, or 2008 server. Allows you to monitor CPU, memory, disk usage, services, processes, and performance counters.
Windows Failed Service restart batch file
Restart Windows Failed Service batch script with log.
Windows Desktop Monitoring Wizard
![]() This Nagios XI wizard allows you to easily monitor a Microsoft® Windows XP, Windows Vista, or Windows 7 desktop. Allows you to monitoring CPU, memory, and disk usage.
This Nagios XI wizard allows you to easily monitor a Microsoft® Windows XP, Windows Vista, or Windows 7 desktop. Allows you to monitoring CPU, memory, and disk usage.
Windows CPU & Memory Checker (powershell)
Full disclaimer: this is a mish-mash of other scripts and random commands found in forums etc. I tried to find the original authors for credit but was unable. Sorry if some of this script is you and you aren't mentioned! Needs to be run from a proxy s ...
William Leibzon - Nagios In Cloud Computing Environment...
Cloud computing is quickly becoming popular way to setup infrastructure for internet sites and allows to create systems and network architecture that can easily scale with increasing traffic and demand. We will explore use of Nagios to monitor cloud infra ...
Weblogic SNMP monitoring
 Weblogic server check via snmp
WebInject
WebInject is a free tool for automated testing of web applications and services. It can be used to test individual system components that have HTTP interfaces (JSP, ASP, CGI, PHP, Servlets, HTML Forms, etc)
Web service monitoring w/ Nagios and JSON
I've written a blog posting that shows how to use JSON formatted data to monitor details of a remote service. The example shows how to monitor the hostname of the system on which an apache web server is running. It's fairly trivial to extend this example ...
Watchport Temperature and Humidity
Checks temperature and humidity using a Watchport Environmental sensor.
WatchGuard Wizard Usage
This document describes how to setup your WatchGuard device and your Nagios XI server to allow for quick and easy monitoring of your WatchGuard device.
Watchguard Wizard
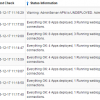
This Watchguard wizard allows quick and easy access to monitoring your Watchguard device. It allows for monitoring several metrics that include: CPU Usage, Active Connections and Interface Bandwidth.
Watchguard Network
 This plugin checks bandwidth and connections of Watchguard device and returns performance data.
Watchguard Memory
 This plugin checks memory usage of Watchguard device and returns memory and swap performance data:
Watchguard Load
 This plugin checks load of Watchguard device and returns load performance data


