
Search Exchange
Search All Sites
Nagios Live Webinars
Let our experts show you how Nagios can help your organization.Login
 New Listings
Directory Tree
Directory
Search Results
The search results below show both sub-categories and individual listings that match your search criteria.
Meet The New Nagios Core Services Platform
Built on over 25 years of monitoring experience, the Nagios Core Services Platform provides insightful monitoring dashboards, time-saving monitoring wizards, and unmatched ease of use. Use it for free indefinitely.
Monitoring Made Magically Better
- Nagios Core on Overdrive
- Powerful Monitoring Dashboards
- Time-Saving Configuration Wizards
- Open Source Powered Monitoring On Steroids
- And So Much More!
Submit Your Nagios Project!
Help build Nagios Exchange for yourself and the entire the Nagios Community by your Nagios project to the site. It's easy - just create an account, login, and add a new listing. Read the FAQ for instructions.Monitoring Ubuntu Nodes with Nagios
This tutorial will give you a head start for working with Nagios in Ubuntu.
Monitoring status Sender/Receive Channel - Windows
This VBScript checks the current state of channel and returning: OK - > RUNNING CRITICAL -> STOP or INACTIVE Warnning -> OTHER
Monitoring Power State On Virtual Machines With Nagios
This article demonstrates how to monitor power states on virtual machines with the check_vmware_status plugin in Nagios.
Monitoring Machines Using The NCPA Agent
This document describes how to use Nagios XI to monitor machines that are using the NCPA agent. NCPA is an advanced, crossplatform agent that can be installed on both Windows and Linux machines.
Monitoring Linux Using SNMP
This document describes how to monitor Linux machines with Nagios XI using SNMP. SNMP is an “agentless” method of monitoring network devices and servers, and is often preferable to installing dedicated agents on target machines.
Monitoring Hosts Using NRPE
 This document describes how to monitor hosts with Nagios XI by using NRPE. This document is intended for use by Nagios XI Administrators who want to setup custom monitoring of servers using NRPE or who
have existing hosts with the NRPE agent already ins ...
This document describes how to monitor hosts with Nagios XI by using NRPE. This document is intended for use by Nagios XI Administrators who want to setup custom monitoring of servers using NRPE or who
have existing hosts with the NRPE agent already ins ...
Monitoring EMC Greenplum Data Computing Appliance (DCA)...
This white paper describes a software plug-in that can be used with the Nagios Core infrastructure monitoring framework to display the state of a wide range of components in the EMC Greenplum Data Computing Appliance (DCA).
Monitoring Check Point (R80.10 and above) IPS Update St...
Runs API query for getting IPS version checks how long that is been installed and gives back "Nagios readable" output. As there was no way to get the actual last version number we are assuming that IPS updates are coming more often than every x days... : ...
Monitoring AzureStack Alerts
Third party plugin written in python used to monitor AzureStack alerts.
Monitoring Architecture Solutions For MSPs
As a Managed Service Provider, you would be able to purchase a separate license for each of your customers and the good news is that we have license levels to fit any size organization, starting as small as 20 Nodes. In this model, we would provide you w ...
Monitoring Apache Session load with Nagios through mod_...
![]() Monitoring Apache Session load with Nagios through mod_status unsing check_apachestatus.pl
Monitoring Apache Session load with Nagios through mod_status unsing check_apachestatus.pl
Monitor Quantum Scalar i3 Tape Libraries via SNMPv3
A clean, production-ready Nagios plugin to check the overall health and operational state of Quantum Scalar i3 tape libraries using SNMPv3 (authNoPriv). The script evaluates and decodes the statuses of key subsystems — including library health, RAS, dri ...
Monitor Multiple Windows Processes
This Perl based plugin is capable of monitoring multiple Windows processes and generating PNP graphs. There is also an option for long/short output. The installation instruction and example outputs are at the website. Feedback/suggestions are welco ...
Monitor ESX hosts in Nagios with CIM and SSH
With attached instructions and scripts you can monitor the following on ESX hosts: * Diskspace (using ssh) * Temperature, various sensors depending on parameter (CIM) * Fans * On HP systems: Disks and RAID status (install HP esx bundle, reboot require ...
Monitor DB2 with Nagios
 Set of Bash scripts to monitor DB2 database by checking different elements of this RDBM. Several criteria of the instances and databases can be analyzed with these scripts.
All scripts return Performance Data to see the evolution of the values across t ...
Set of Bash scripts to monitor DB2 database by checking different elements of this RDBM. Several criteria of the instances and databases can be analyzed with these scripts.
All scripts return Performance Data to see the evolution of the values across t ...
Molniya XMPP gateway
Molniya presents an IM interface for Nagios, so you can receive and react to problem notifications from Nagios in a convenient way. It uses XMPP (as well as SMTP) for communications. In addition to receiving notifications, you can request status reports, ...
Mod Gearman
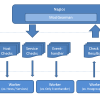 Distribute Hostchecks, Servicechecks and Eventhandler with Gearman. Replace distributed Nagios installations with Gearman worker for easy high availability. Host/Servicegroup affinity included.
MobiosPush
 MobiosPush is a Nagios mobile frontend for iPhone with push notifications.
* Unlimited notifications free of charge
* iOS 8 interactive notifications
* No software changes to your Nagios server required
* Native iOS 7 & 8 app with modern UI
* View ...
MobiosPush is a Nagios mobile frontend for iPhone with push notifications.
* Unlimited notifications free of charge
* iOS 8 interactive notifications
* No software changes to your Nagios server required
* Native iOS 7 & 8 app with modern UI
* View ...
MK Livestatus
Livestatus is a tool to access the host and service status of your Nagios server
minimalistic check_disk.sh
Another but minimalistic disk check/status plugin. This script will show only local file-systems, local partitions are sorted from the most in use (as occupancy).


