Search Exchange
Search All Sites
Nagios Live Webinars
Let our experts show you how Nagios can help your organization.Login
Directory Tree
Directory
Search Results
The search results below show both sub-categories and individual listings that match your search criteria.Meet The New Nagios Core Services Platform
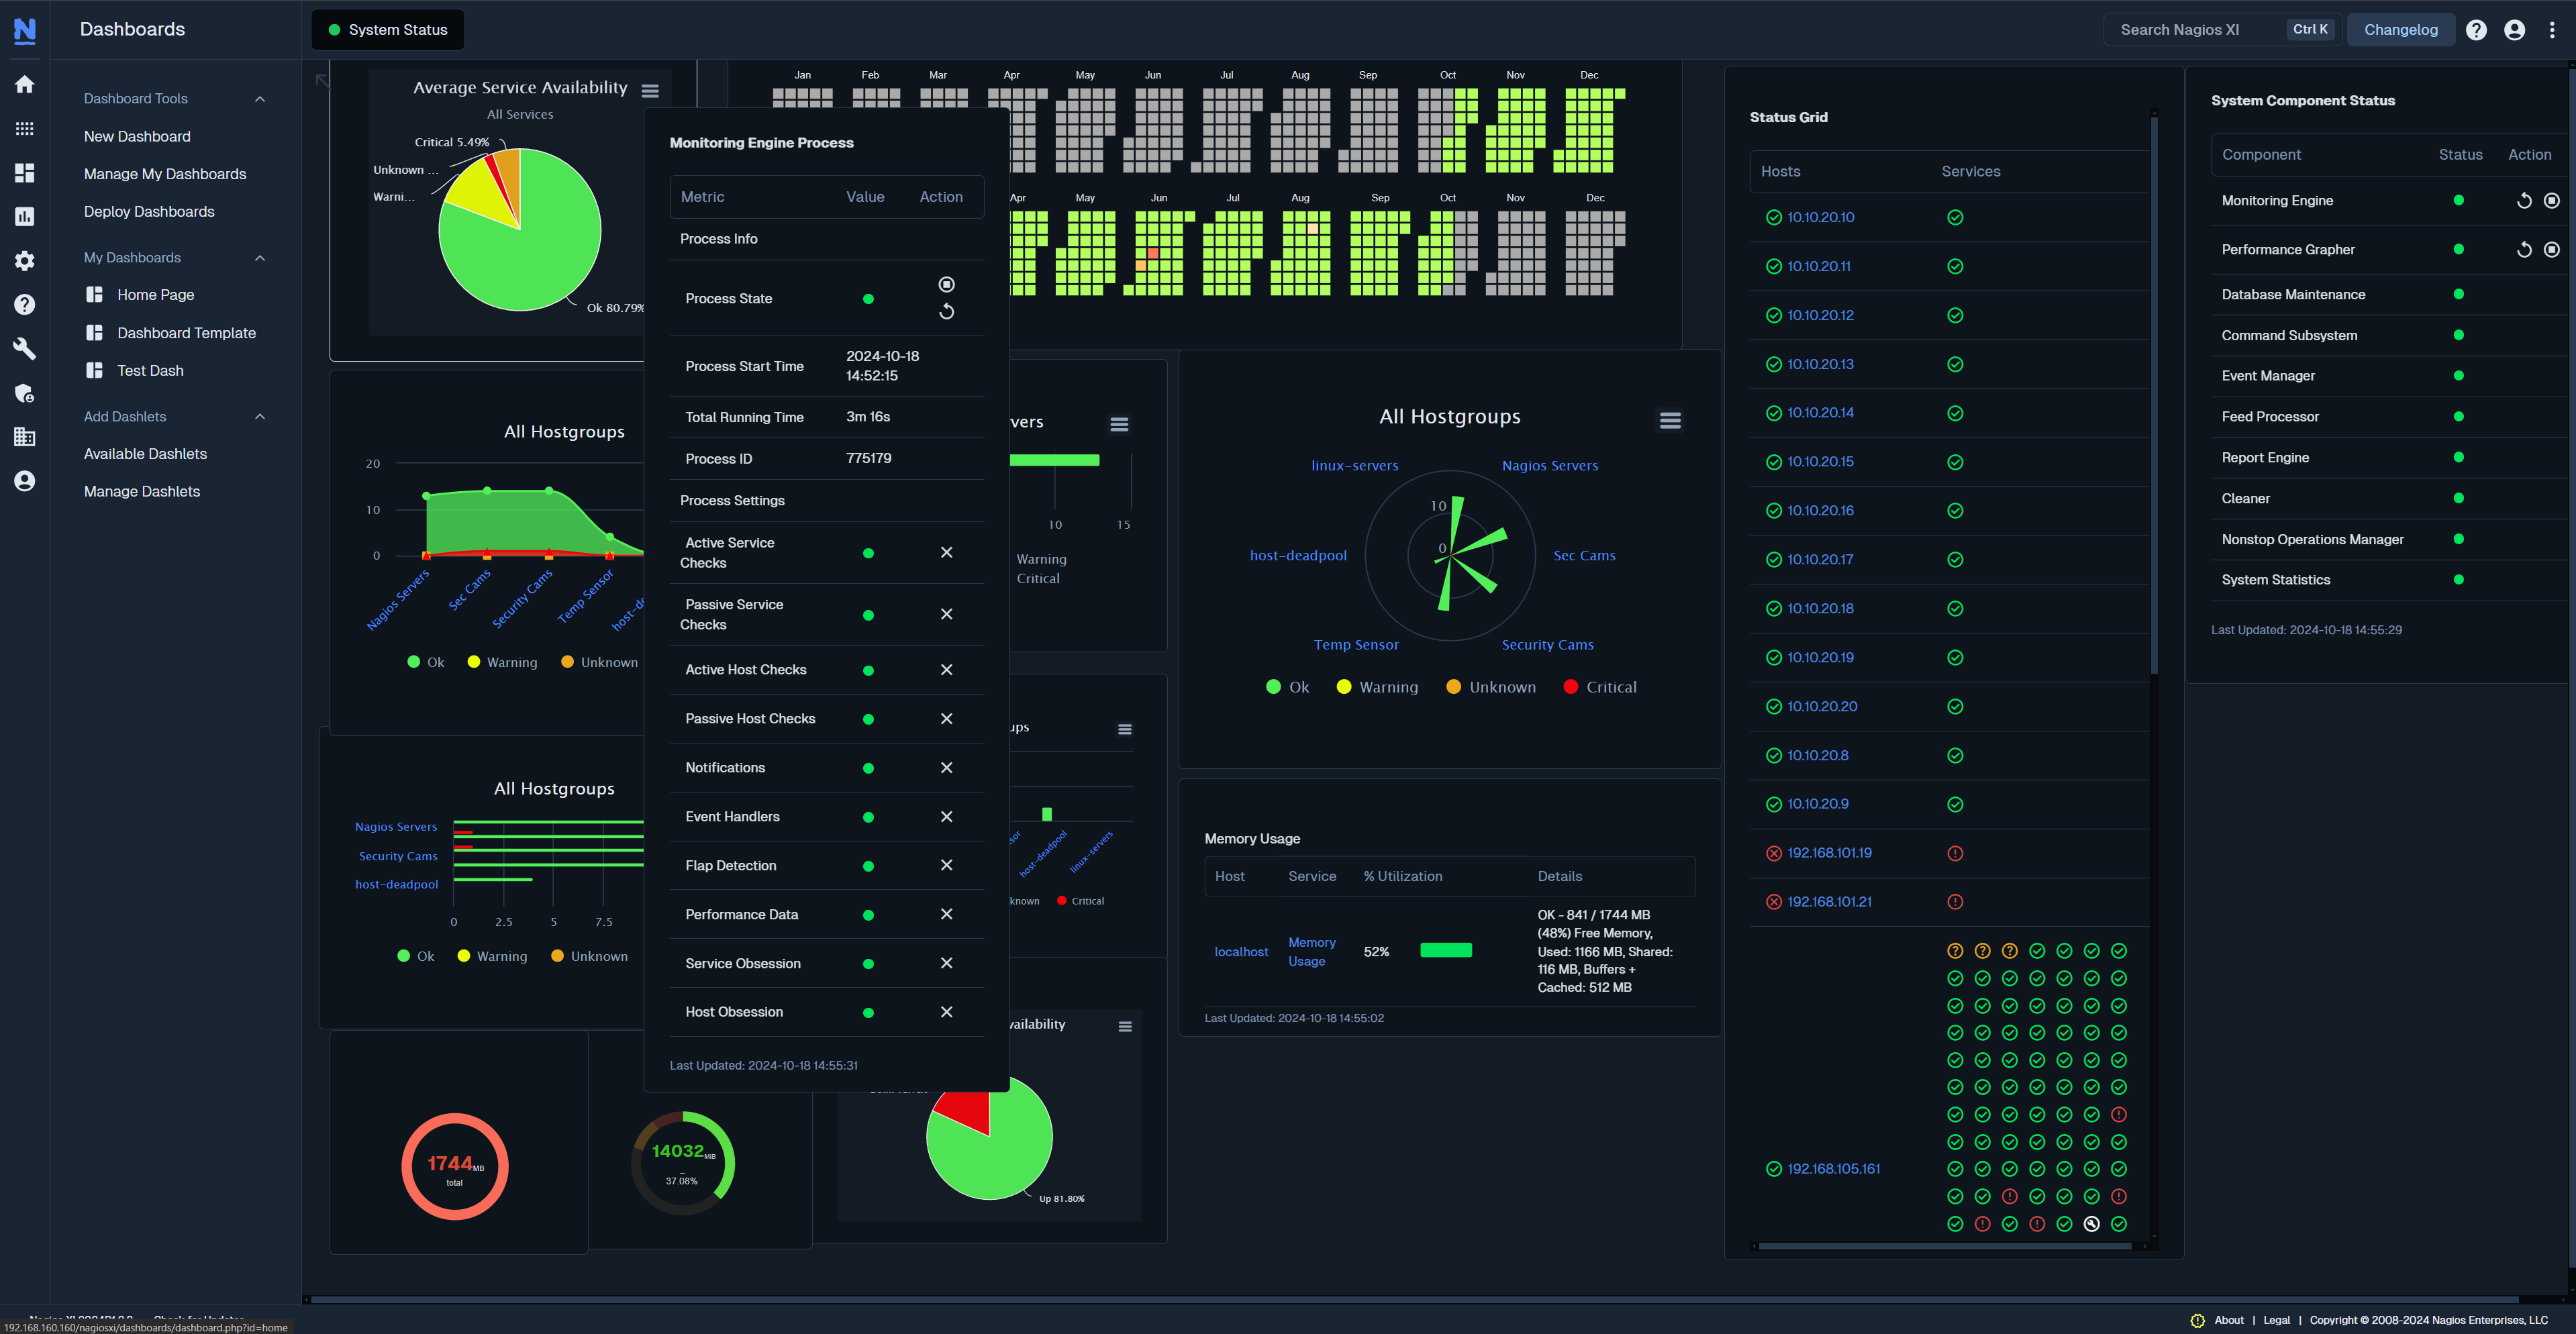
Built on over 25 years of monitoring experience, the Nagios Core Services Platform provides insightful monitoring dashboards, time-saving monitoring wizards, and unmatched ease of use. Use it for free indefinitely.
Monitoring Made Magically Better
- Nagios Core on Overdrive
- Powerful Monitoring Dashboards
- Time-Saving Configuration Wizards
- Open Source Powered Monitoring On Steroids
- And So Much More!
Submit Your Nagios Project!
Help build Nagios Exchange for yourself and the entire the Nagios Community by your Nagios project to the site. It's easy - just create an account, login, and add a new listing. Read the FAQ for instructions.Mac OS X Wizard
![]() A Nagios XI configuration wizard for monitoring Mac OS/X workstations and servers.
A Nagios XI configuration wizard for monitoring Mac OS/X workstations and servers.
lwp-download-speed
lwp-download-speed is a nagios-plugin based on the perl-download-program "lwp-download". This plugin is useful to measure the speed of a http-download.
lufft-l2p-nagios-plugin
This is a Nagios Plugin for monitoring L2P Devices.
luanagios
 Luanagios allows to write NAGIOS check plugins in Lua.
Currently two modules are provided:
check_host.lua
- memory/disk usage, system load checking for host computers (Linux, MacOS or Windows) using SNMP
check_fritz.lua
- uptime, lan/wan/wlan stati ...
Looping Through a List
This article shows a community-distributed script for monitoring and responding to web site attacks with Nagios.
Loop Test Event Chain
This is a sample event chain for Nagios Reactor that demonstrates how to create loops. Import the JSON file into Nagios Reactor to create a new event chain that contains the loop.
Logging into Nagios Log Server
Nagios Log Server is the easy and powerful way to collect and analyze your application and server logs.
Logfile Lovin: Marrying Nimrod and Nagios for Software ...
This article demonstrates how to use Nagios to pull data from Nimrod metrics server.
Log Monitoring with Swatch
This document describes how to use the Simple Log Watcher (Swatch) in conjunction with Nagios in order to be notified when certain events are noted in the system log.
Local config file based monitoring
A set of Perl and VB scripts that monitor key resources (Process, Disk, Log etc.) using thresholds read from local configuration files. Uses NRPE and NSCA plugins to send passive checks to Nagios.
Local AD check for Azure AD Synchronization
A simple script which checks the local server that Azure AD Connect runs on for the following: * Time since successful synchronization with Azure AD * Time since successful password synchronization with Azure AD * Errors in event log indicating probl ...
Load metadata to a context variable
This action can be added into Nagios Reactor to read a persistent metadata value and copy it to a context variable.
lnvgy-sw-lxce-nagios-plugin
This is a Nagios plugin that retrieves health status from Lenovo ThinkSystem. It provides complete hardware-level visibility including detailed inventory, health status (both overall and component-level health status) for supported devices. It also has th ...
LiveBoard dashboard
 LiveBoard is a real-time alerts dashboard for Nagios XI.
Linux Software RAID Nagios Monitoring & Failure Simulat...
This is an overview of how to use the Linux mdadm tool to create, remove and rebuild a software RAID 1 (mirror) device. You will also learn about the Nagios check_linux_raid plugin.
Linux Nagios XI Wizard
![]() A Nagios XI configuration wizard for monitoring Linux workstations and servers.
A Nagios XI configuration wizard for monitoring Linux workstations and servers.
Linux Downtime Script - Perl
This Perl script sends a HTTP-GET request to the Nagios web interface. As a result, there will be no notifications generated for the defined time. This script can be used to schedule a downtime for a host on every reboot. By Lars Michelson.
Linux Check Service
Nagios plugin to check if a service is running. It uses systemd. Simple, and one function only.
Linux Check PPS, BPS, or Current Line Rate % of NIC
Nagios plug-in that calculates receiving PPS, BPS, and percentage of line-rate (LR) from Linux kernel statistics by reading from procfs and notifies if above a given threshold.
Lilac-Reloaded
 Lilac
Lilac-Reloaded is an easy configuration interface for nagios. We have decided to update the code of Lilac and develop improvements.
Lilac
Lilac-Reloaded is an easy configuration interface for nagios. We have decided to update the code of Lilac and develop improvements.

 Directory
 New Listings