
Search Exchange
Search All Sites
Nagios Live Webinars
Let our experts show you how Nagios can help your organization.Login
 New Listings
Directory Tree
Directory
Search Results
The search results below show both sub-categories and individual listings that match your search criteria.
Meet The New Nagios Core Services Platform
Built on over 25 years of monitoring experience, the Nagios Core Services Platform provides insightful monitoring dashboards, time-saving monitoring wizards, and unmatched ease of use. Use it for free indefinitely.
Monitoring Made Magically Better
- Nagios Core on Overdrive
- Powerful Monitoring Dashboards
- Time-Saving Configuration Wizards
- Open Source Powered Monitoring On Steroids
- And So Much More!
Submit Your Nagios Project!
Help build Nagios Exchange for yourself and the entire the Nagios Community by your Nagios project to the site. It's easy - just create an account, login, and add a new listing. Read the FAQ for instructions.Installing XI Dashlets
Dashlets are addons for Nagios XI that are used as "containers" to display specific information in UI. Once installed, users can add dashlets to one or more of their dashboards, allowing them to customize the look and feel of the information they find mos ...
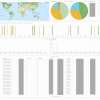
IIS Dashboard
 The IIS dashboard for nagios log server will allow you to visualize many different variations of response time compared to various metrics. Other informative details such as, most and least found instances of useragent, uri, and response code, provide a w ...
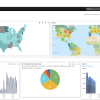
Exchange 2010/2013 Message Tracking Logs
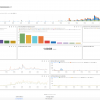 This dashboard monitors the Message Tracking Logs in Exchange 2010 onwards.
I can't take credit for developing this, I just adapted it for NLS - Original creator here: https://elijahpaul.co.uk/analysing-exchange-2013-message-tracking-logs-using-elk-ela ...
This dashboard monitors the Message Tracking Logs in Exchange 2010 onwards.
I can't take credit for developing this, I just adapted it for NLS - Original creator here: https://elijahpaul.co.uk/analysing-exchange-2013-message-tracking-logs-using-elk-ela ...
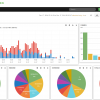
DHCP Messages
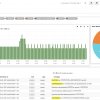 A custom dashboard to give a breakdown on the different DHCP Messages. This has a query filter where the type must be syslog and the program must be dhcpd.
Dashboard Deployment XI Component
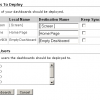 This Nagios XI component allows admins to deploy one or more of their own dashboards to other users. This can be useful when you design a dashboard that other users may want access to. Includes the ability to keep user's dashboards synchronized with the ...
Dashboard 0.2.1 - Python
Python based Dashboard that allows user based dashboards with custom grouping of items. Works with both Nagios and Nagios under Groundwork.
DashBoard
DashBoard allows you to create custom pages (create & edit on-the-fly) with service and host status monitoring for every user separately. You can create groups and subgroups so you can view all necessary information in just one page.
Cisco ASA VPN Monitoring
 Dashboard that shows information about VPN sessions on Cisco ASA Devices.
check_datameer_stats.pl (Advanced Nagios Plugins Collec...
Shows Datameer stats on number of Workbooks, Connections (Data Connectors), Import and Export Jobs, Dashboards and Infographics using the Datameer Rest API, outputs perfdata for Nagios graphing of these usage trends over time
check_aws_status
Check the AWS Service Health Dashboard for service interruptions/incidents.
check_aws_events
Check current event logs information from the AWS Service Health Dashboard The endpoint for the API is: https://health.us-east-1.amazonaws.com (provides event data for all regions) usage: check_aws_events.py -s EC2|RDS -r us-east-1|us-west-1|us-west ...
check-dashboard
Check to see if puppet-dashboard and friends are running.
Better Apache Dashboard
 The "Better Apache Dashboard" also know as the 5 minute dashboard as presented at the 2014 Nagios World Conference.
View the conference slides at
http://www.nagios.com/events/nagiosworldconference/northamerica/2014/speakers#Scott-Wilkerson
The "Better Apache Dashboard" also know as the 5 minute dashboard as presented at the 2014 Nagios World Conference.
View the conference slides at
http://www.nagios.com/events/nagiosworldconference/northamerica/2014/speakers#Scott-Wilkerson
Asterisk Log Analyzer
 Parses Asterisk log files and splits fields into new "asterisk_" prefixed terms. Dashboard shows number of simultaneous inbound and outbound calls, top 10 producers of calls, top 10 inbound numbers being dialed, top 10 outbound numbers being dialed, sour ...
AD Lockouts
Simple dashboard to show locked out accounts, use the query to alert happy valentines day love from Australia


