
Search Exchange
Search All Sites
Nagios Live Webinars
Let our experts show you how Nagios can help your organization.Login
 New Listings
Directory Tree
Directory
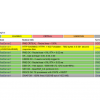
Search Results
The search results below show both sub-categories and individual listings that match your search criteria.
Meet The New Nagios Core Services Platform
Built on over 25 years of monitoring experience, the Nagios Core Services Platform provides insightful monitoring dashboards, time-saving monitoring wizards, and unmatched ease of use. Use it for free indefinitely.
Monitoring Made Magically Better
- Nagios Core on Overdrive
- Powerful Monitoring Dashboards
- Time-Saving Configuration Wizards
- Open Source Powered Monitoring On Steroids
- And So Much More!
Submit Your Nagios Project!
Help build Nagios Exchange for yourself and the entire the Nagios Community by your Nagios project to the site. It's easy - just create an account, login, and add a new listing. Read the FAQ for instructions.Nagios Fusion 4 – Dashboards – Deploying Dashboards
Connect multiple Nagios XI or Nagios Core instances inside one central interface with Nagios Fusion. Happy monitoring! This dashboard tutorial shows how to swiftly deploy dashboards to other users in Nagios Fusion 4.
Nagios Fusion 4 – Dashboards – Adjusting Dashlet Se...
Connect multiple Nagios XI or Nagios Core instances inside one central interface with Nagios Fusion. Happy monitoring! This dashboard tutorial shows how to quickly adjust dashlet settings in Nagios Fusion 4.
Nagios Fusion 4 - Dashboards - Creating Dashboards
Connect multiple Nagios XI or Nagios Core instances inside one central interface with Nagios Fusion. Happy monitoring! This dashboard tutorial shows how to easily create dashboards in Nagios Fusion 4.
Nagios Fusion 4 - Dashboards - Adding a Dashlet To A Da...
Connect multiple Nagios XI or Nagios Core instances inside one central interface with Nagios Fusion. Happy monitoring! This dashboard tutorial shows how to easily add dashlets to dashboards in Nagios Fusion 4.
Nagios Dashboard PHP - 2022
 This is an update to the Nagios Dashboard - PHP project, which was submitted several years ago. This update fixes some bugs in the original project and adds some features. It also uses the nagios stylesheets, so that the style matches the rest of Nagios ...
Nagios Dashboard - PHP
 PHP-based Nagios Dashboard lists hosts/services in a table with colors/fonts indicating up, down, warning, critical.
Nagios Dash from NDOUtils
 Forked Nagios Dashboard – PHP and select data from NDOUTILS DB.
Easy to monitor Unhandled error only.
Forked Nagios Dashboard – PHP and select data from NDOUTILS DB.
Easy to monitor Unhandled error only.
Nagios Dash
 We forked Nagios Dashboard – PHP and gave it a new look, rewrote the code with ajax for our needs.
It parses the status.dat and gives you a dashboard for ex. viewing on a operations screen.
We forked Nagios Dashboard – PHP and gave it a new look, rewrote the code with ajax for our needs.
It parses the status.dat and gives you a dashboard for ex. viewing on a operations screen.
Nagios Client - Status Monitor
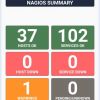 Easy to use Nagios status monitoring app.
Dashboard has count of Host Up, Down, Service Ok, Warning, Critical, Pending and Unknown.
Easy to use Nagios status monitoring app.
Dashboard has count of Host Up, Down, Service Ok, Warning, Critical, Pending and Unknown.
Nagios Check Plugin For Google App Dashboard
In this article, you can read about a Nagios check plugin for the Google Apps Status Dashboard.
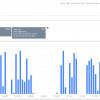
Nagios - Stats
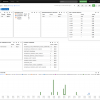 Statistical information about Nagios This dashboard relies on the Nagios Core input filter
Nagios - Services
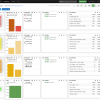 Break down of Service states This dashboard relies on the Nagios Core input filter
Nagios - Notifications
 Break down of Nagios Notifications This dashboard relies on the Nagios Core input filter
Nagios - Hosts
 Break down of host states This dashboard relies on the Nagios Core input filter
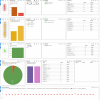
Nagex
 Nagex is a Nagios intranet dashboard project driven by event handlers which feeds data to a MySQL database. The PHP script pulls the data for your internal/external company users to view infrastructure status information without giving them access to the ...
NagDash v.0.1
 Simple dashboard interface for Nagios, written in PHP with MySQL database backend.
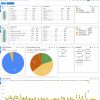
McAfee Web Gateway Dashboard
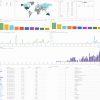 This dashboard allows you to easily see where your web traffic is going if you use McAfee Web Access gateways.
Mail Log Dashboard
 I have seen plenty of Nagios XI users, who would not receive alerts, because they haven't set up sendmail/postfix properly.
Searching the mail log for "bounced" errors may be helpful for identifying these issues.
My second query is for finding segf ...
I have seen plenty of Nagios XI users, who would not receive alerts, because they haven't set up sendmail/postfix properly.
Searching the mail log for "bounced" errors may be helpful for identifying these issues.
My second query is for finding segf ...
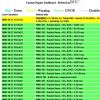
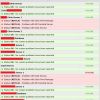
LiveBoard dashboard
 LiveBoard is a real-time alerts dashboard for Nagios XI.
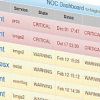
Latest Alerts XI Component
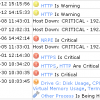 This Nagios XI component allows you to quickly see the latest host and services alerts in your monitored environment. The alert dashboard shows which problems are handled or unhandled and which services are impacted by problems. It also allows you to q ...


