Search Exchange
Search All Sites
Nagios Live Webinars
Let our experts show you how Nagios can help your organization.Login
Directory Tree
Directory
Search Results
The search results below show both sub-categories and individual listings that match your search criteria.Meet The New Nagios Core Services Platform
Built on over 25 years of monitoring experience, the Nagios Core Services Platform provides insightful monitoring dashboards, time-saving monitoring wizards, and unmatched ease of use. Use it for free indefinitely.
Monitoring Made Magically Better
- Nagios Core on Overdrive
- Powerful Monitoring Dashboards
- Time-Saving Configuration Wizards
- Open Source Powered Monitoring On Steroids
- And So Much More!
Submit Your Nagios Project!
Help build Nagios Exchange for yourself and the entire the Nagios Community by your Nagios project to the site. It's easy - just create an account, login, and add a new listing. Read the FAQ for instructions.- Dashboards (22 listings)
- Dashboard Tutorials (5 listings)
Mobile Admin Featured
 Rove Mobile Admin – IT Management From Your Smartphone. Featuring a Real-time Dashboard that displays Nagios notifications directly on your mobile device, you are alerted to problems as soon as they are detected. Drilling into the problem is fast and ef ...
Windows Updates Dashboard
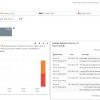 The following dashboard shows you how many total Windows Updates are
pending in the pipe, as well as the most recently installed updates. The
query filters for EventID 17 (pending) and 19 (installed). The dashboard
has two trimmed tables for the most r ...
Windows - Sys Admin Dashboards
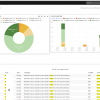 I use these dashboards to troubleshoot Windows issues and if no "customer" issues are present I can dig through the event logs and find issues that are not causing work stoppages (yet) and try to fix them ahead of time.
Windows - Security Sys Admin Dashboards
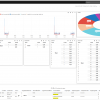 Dashboards used for Sys Admin Security monitoring and alerting.
TIP: Set up dashboard alerts, then you don't have to physical check all your dashboards.
Uppsikt
Uppsikt is a simple, live-status-powered dashboard.
Understanding And Using XI Dashboards
This document describes Nagios XI dashboards, what they can be used for, and how they can be managed.
Understanding And Using Dashboards In Nagios Fusion
This document describes Nagios Fusion dashboards, what they can be used for, and how they can be managed. This document is intended for use by Nagios Fusion Administrators and Users.
syslog Types
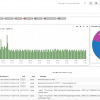 Simple Dashboard that has all the syslog types (0-7) pinned with a pie chart showing the breakdown. NOTE: The filter is configured to only show results that are of type:syslog.
Successful Windows Login Dashboard
 Successful Windows Login, is a Query that checks the logserver's log for EventID:4624 and that EventID is for when a user has logged in to their PC correctly.
VMWare Guest Power On is a Query that checks when a Guest VM running on a ESX server is power ...
Status Info Dashlet
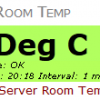 This Dashlet allows you to select a service definition and display the current status information as a Dashlet. For example, you want to watch the free space check on a particular server (it's been fluctuating recently for no reason). This Dashlet allow ...
Simple Nagios PHP Dashboard
 Simple Nagios PHP Dashboard (SNPD) is the light Web Interface for the Nagios 4.1.0+.
Simple Account Lockout Tracking Dash
This is a simple, clean dashboard with a pretty basic query. But it gives you relevant information for tracking down and identifying issues with users and account lockouts. Lockout events over time, top users that have been locked out, top sources of ...
Security Dashboard
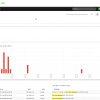 The security dashboard assumes /var/log/messages and /var/log/secure are being monitored. The associated query looks for things like "segfault" and "Failed password" and other things which may indicate an attack.
The second query looks for "Port scan ...
RSS Feed Dashlet
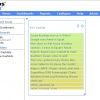 Create a custom RSS feed with up to 5 sources. The feed is color-coded by newest to oldest, and scrolls as a list in order to save dashboard space.
Netfilter dashboard
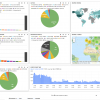 Dashboard and filter for parsing and displaying netfilter/iptables logs.
nagios-googleapps
This is a simple nagios plugin that checks the google apps services status from the dashboard.
Nagios XI Online Demo
 An online demo of Nagios XI. The demo allows you to test configuration wizards, dashlets, dashboards, views, and more.
Nagios StatView
 Nagios StatView is a dashboard for Nagios.
It is designed for TV monitors of 32-40? and to give a quick health status of the network.
Nagios Log Server - Analyzing Logs
This document describes how to use queries and filters to drill down to see the exact information you are looking for using the Nagios Log Server search dashboard. This document is intended for use by Nagios Log Server administrators and users looking ...
Nagios Fusion 4 – Dashboards – Screen Dashboard
Connect multiple Nagios XI or Nagios Core instances inside one central interface with Nagios Fusion. Happy monitoring! This dashboard tutorial shows how to use the screen dashboard that sits on top of the interface in Nagios Fusion 4.

 Directory
 New Listings