
Search Exchange
Search All Sites
Nagios Live Webinars
Let our experts show you how Nagios can help your organization.Login
 New Listings
Directory Tree
Directory
Search Results
The search results below show both sub-categories and individual listings that match your search criteria.
Meet The New Nagios Core Services Platform
Built on over 25 years of monitoring experience, the Nagios Core Services Platform provides insightful monitoring dashboards, time-saving monitoring wizards, and unmatched ease of use. Use it for free indefinitely.
Monitoring Made Magically Better
- Nagios Core on Overdrive
- Powerful Monitoring Dashboards
- Time-Saving Configuration Wizards
- Open Source Powered Monitoring On Steroids
- And So Much More!
Submit Your Nagios Project!
Help build Nagios Exchange for yourself and the entire the Nagios Community by your Nagios project to the site. It's easy - just create an account, login, and add a new listing. Read the FAQ for instructions.Wlsagent
Wlsagent is a Nagios plugin which aims to provide JMX monitoring capabilities for WebLogic servers (9 & 10), whith the smallest possible memory footprint. Monitoring is achieved with simple HTTP requests, through the use of an embedded Jetty container. ...
Wasagent
This project is a Nagios plugin which aims to provide JMX monitoring capabilities for WebSphere servers (6.1, 7.0 & 8.0), with the smallest possible memory footprint. Nagios monitoring is achieved with simple HTTP requests, through the use of an embedd ...
Syabru Nagios JMX Plugin
Nagios JMX plugin to retrieve and monitor runtime data from Java VM's and other applications supporting JMX. The plugin supports Nagios performance data and operation invocation on MBeans for resetting statistical data or counters. It also supports regula ...
send_JMX_ActiveThread
send_JMX_ActiveThread is a script which can be used to send active thread count of a jmx console through nsca(as passive checks).
Nagios XI – How To Monitor JMX With Nagios XI
This document will cover how to monitor java application servers as well as how to configure check_jmx within Nagios® XI™ in order for users to be notified when java applications are not functioning properly. This document is intended for use by Nag ...
Nagios plugin for Alfresco
This package contains a Nagios Java plugin to check via JMX values to Alfresco Enterprise 3.2 and above. Contains more than 15 checks. It supports performance data to graph results of checks with pnp4nagios. More information: http://blyx.com
Monitoring Liferay with Nagios, Jolokia and JMX4Perl
This blog article demonstrates how to monitor Liferay with Nagios.
Monitoring JBoss AS6.x With check_jmx Plugin
This tutorial shows you how to monitore a jboss server jvm via jmx and Nagios.
jmx_stats
The java program to check JMX and can be used with AppFirst collector to make one connection to JMX and get all the metrics at one time.
How To Monitor Jetty JMX With Nagios XI
This document will cover how to monitor Jetty JMX servers using the Jetty wizard and check_jvm.jar plugin within Nagios XI, so that users may be notified when Jetty applications are behaving unexpectedly. This document is intended for use by Nagios XI ...
check_tomcat (bash)
check_tomcat (plugin for Nagios) The 'check_tomcat' script is designed to monitor Apache Tomcat through JMX Proxy Servlet in combination with 'check_by_ssh' plugin. The first step is to ensure that the central Nagios server is able to connect to the re ...
check_jmxeval
JMXEval is a really flexible plugin for monitoring Java applications using JMX. Instead of just checking just an attribute of an MBean, JMXEval allows you to query multiple MBean attributes as well as results of MBean method invocations, and also perform ...
check_jmx4perl
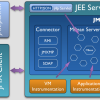 check_jmx4perl is a Nagios Plugin for monitoring JEE Server via JMX. It uses an agent based approach where the plugin accesses a special servlet deployed on a JEE Server. check_jmx4perl has been tested on a multitude of JEE Servers.
check_jmeter-scenario.pl
This plugin is able to check a JMX plan. You're now able to use a scenario to check your web server. This plugin is inspired by the work of Travis Noll (http://yoolink.to/eG3)
check_java
Allows to check the health of Java applications through JMX. Includes checks for Heap Memory usage, Non-Heap Memory usage, usage of various memory pools, number of loaded classes, number of threads, number and time of Garbage Collector runs.
check_hbase_regionserver_jmx.pl (Advanced Nagios Plugin...
Nagios Plugin to parse metrics from a given HBase RegionServer's /jmx page
check_hbase_metrics.pl (Advanced Nagios Plugins Collect...
Checks HBase JMX metrics from HBase Masters & RegionServers
check_hbase_master_jmx.pl (Advanced Nagios Plugins Coll...
Nagios Plugin to parse metrics from a given Hadoop Master's /jmx page
check_hadoop_namenode_jmx.pl (Advanced Nagios Plugins C...
Nagios Plugin to parse metrics from a given Hadoop NameNode's /jmx page


