
Search Exchange
Search All Sites
Nagios Live Webinars
Let our experts show you how Nagios can help your organization.Login
 New Listings
Directory Tree
Directory
Search Results
The search results below show both sub-categories and individual listings that match your search criteria.
Meet The New Nagios Core Services Platform
Built on over 25 years of monitoring experience, the Nagios Core Services Platform provides insightful monitoring dashboards, time-saving monitoring wizards, and unmatched ease of use. Use it for free indefinitely.
Monitoring Made Magically Better
- Nagios Core on Overdrive
- Powerful Monitoring Dashboards
- Time-Saving Configuration Wizards
- Open Source Powered Monitoring On Steroids
- And So Much More!
Submit Your Nagios Project!
Help build Nagios Exchange for yourself and the entire the Nagios Community by your Nagios project to the site. It's easy - just create an account, login, and add a new listing. Read the FAQ for instructions.n2rrd Featured
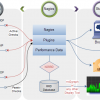 N2RRD (Nagios to Round Robin Database) is a Nagios add-on tool, which stores performance data generated by Nagios plugins into an Round-Robin-Database (see RRDtool). The package also includes the display tool rrd2graph to view data stored in an RRD databa ...
Tony Roman - Cacti Workshop
The workshop will cover implementing Cacti in large environments. Other topics - including automation and Nagios integration - may also be covered.
Script package for oracle
It's a script package for monitoring and graph database data in nagios and pnp4nagios or cacti. Maybe another exits before this, but here we make a perfdata usable for pnp4nagios, cacti and others similar graph tool. 1. Check_waits_cluster.sh and ch ...
Network and System Monitoring with Nagios and Cacti
 Boise Code Camp Presentation
nagios2cacti
Nagios 2 Cacti, N2Cacti, is a project derived from N2RRD. N2cacti will parse Nagios Configuration, read N2RRD configuration (modified version homemade) and will configure Cacti to create a Graph by Nagios Services.
Monitoring System with CentOS+Nagios+Cacti Part 3/3
 Part 3/3 of creating a system for monitoring your network using CentOS, Nagios, and Cacti.
Monitoring System with CentOS+Nagios+Cacti Part 2/3
 Part 2/3 of creating a system for monitoring your network using CentOS, Nagios, and Cacti.
Monitoring System with CentOS+Nagios+Cacti Part 1/3
 Part 1/3 of creating a system for monitoring your network using CentOS, Nagios, and Cacti.
Monitoring Interface Bandwidth Utilization Using Cacti ...
This Python plugin will alert when the average bandwidth utilization of a network interface exceeds the configured thresholds. It uses data that is already being captured on a remote (or local) Cacti server rather than storing data in a local database. Ma ...
Matt Wall - Performance Graphing and Trending In Nagios
This presentation covers graphing/trending topics, with nagiosgraph as the example implementation and covering some best practices (e.g. rrdtool issues, data collection options, data freshness, host/service naming, aggregation versus specialization, autom ...
Larry Adams - 10 Years Of Cacti
This presentation covers topics relating to the use and deployment of Cacti and other monitoring solutions.
Installing Nagios 3.1.2 And Cacti 0.8.7e On Ubuntu Serv...
This tutorial will show you how to install Nagios 3.1.2 and Cacti 0.8.7e on Ubuntu Server 9.
Exchange 2010 Performance Counters
 Here are several scripts I put together to monitor various exchange 2010 performance counters. Activesync, Memory, Database, RPC, Message Queue, Throttling counters. A good start for getting a handle on Exchange 2010. Hope people can find this useful. ...
Daniel Wittenberg - Scaling Nagios At A Giant Insurance...
This presentations covers all aspects of Nagios needed to scale to a large environment with over 35,000 devices and 1.4 million service checks. It discuses the hardware, operating system, Nagios Core, plugins, and configurations that you can use in a larg ...
check_rrdtraf.php
Because of my work I had to write a little PHP script to integrate with Nagios. It works checking local RRD databases (Nagios and Cacti on same computer for example) for incoming or outgoing transfer rates.
check_ifoperstatus with DS1 ISDN HSRP and Cacti support
check_ifoperstatus script that use IF-MIB,DS1-MIB,ISDN-MIB,CISCO-HSRP-MIB (ePN compliant) (cacti lookup support)
check_graphite_metric
Use curl to retrieve a specified metric from a graphite http interface and determine status based on hi/lo ranges. Useful to integrate Nagios and Graphite "à la cacti".
Changing the Cacti Admin Password
A video tutorial that shows you how to login to Cacti and change the admin password. NOTE: As of Nagios 2009R1.1 release, Cacti is no longer pre-configured on the XI virtual machine.


