
Search Exchange
Search All Sites
Nagios Live Webinars
Let our experts show you how Nagios can help your organization.Login
 New Listings
Directory Tree
Directory
Search Results
The search results below show both sub-categories and individual listings that match your search criteria.
Meet The New Nagios Core Services Platform
Built on over 25 years of monitoring experience, the Nagios Core Services Platform provides insightful monitoring dashboards, time-saving monitoring wizards, and unmatched ease of use. Use it for free indefinitely.
Monitoring Made Magically Better
- Nagios Core on Overdrive
- Powerful Monitoring Dashboards
- Time-Saving Configuration Wizards
- Open Source Powered Monitoring On Steroids
- And So Much More!
Submit Your Nagios Project!
Help build Nagios Exchange for yourself and the entire the Nagios Community by your Nagios project to the site. It's easy - just create an account, login, and add a new listing. Read the FAQ for instructions.Nagios Comparison To Centreon
 See how Nagios compares to Centreon and beats it on features, capabilities, cost, ROI, and TCO. Save tens of thousands per year and obtain greater results by using Nagios!
Monitoring Xsan With Nagios and SNMP
This tutorial explains how to monitor Xsan with Nagios and SNMP.
Linux Route Check
A tool for checking routes on a linux device. This is great for environments with regularly changing networks, it outputs performance data when routes are added or deleted. I used it to keep track of the multiple routes we have to and from our SAN netw ...
Inter server port monitoring
Hi Team, Plugin will helps you to monitor whether given port is listening between the Server A and Server B or not. i.e from Server C you can check port listened between Server A to Server B. Achieved the same by writing two lines of simple code. ...
iNag2
 iNag2 is the encore to the award wining app used by thousands of network administrators around the world.
• Process information and control
• Available Push Alerts
• Host and Service grouping.
• Comments viewable for both Host and Services. ...
iNag2 is the encore to the award wining app used by thousands of network administrators around the world.
• Process information and control
• Available Push Alerts
• Host and Service grouping.
• Comments viewable for both Host and Services. ...
IBM Storwize V7000
This plugin tests an IBM Storwize V7000. The V7000 uses IBM's San Volume Controller (SVC) code as the base for its controllers, so this health check may work with SVC itself, but I can't test that. For this script to work, you need to first setup an ...
IBM StorWize V3700 / V7000 check
This plugin is an updated / modified version of the plugin found at: https://exchange.nagios.org/directory/Plugins/Hardware/Storage-Systems/SAN-and-NAS/IBM-San-Volume-Controller/IBM-v7000--2D-v7000-Unified/details. Tested to work with: - IBM StorWize ...
IBM SAN Volume Controller (SVC) and IBM Storvize Monito...
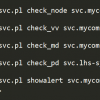 Perl script uses Expect to login to IBM SAN Volume Controller (SVC) or IBM Storvize device via ssh. There is no additional software required. Can be used for nagios, op5, etc. monitoring.
IBM 2005 B16 (brocade 200E) fiberswitch
Plugin to check the status of the IBM 2005 B16 Brocade SAN switches.
HP Lefthand Volume Size check
This script, building upon the existing https://exchange.nagios.org/directory/Plugins/Hardware/Storage-Systems/SAN-and-NAS/HP-Lefthand-P4000-Cluster-Volume-check/details plugin checks individual volumes and returns a percentage used. A small amount of wo ...
HP Lefthand SAN/iQ hardware and software check
Check script for HP LeftHand SAN/iQ devices. Gives status of hardware, drive information and array information.
How To Monitor Cassandra with Nagios
This article will demonstrate how to monitor Cassandra with Nagios.
High throughput NCSA replacement
NCSA replacement capable or processing thousands of service check results per second
EMC CLARiiON Monitoring Wizard
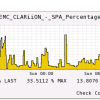 This Wizard allows you to monitor an EMC CLARiiON SAN. You can monitor the following components of the SAN: * Storage Processors = Status of each SP * Storage Processors Information = Gets information on the SP (SP ID, Agent Revision, FLARE Revision, PRO ...
dhcpd-pools
An utility to monitor very large dhcpd installations, e.g. such which has tens of thousands of active leases, with analysis time of less than second or two. When command is ran with --warning or --critical options Nagios compatible summary output, and ...
chk_ifx
Reporta el estado del servidor usando el comando onstat - Reports the server state using onstat - command.
check_xsan
check_xsan is an quite sophisticated controler to check MDC status over one Xsan* CFS
check_vsphere
This monitoring plugin is able to check various aspects of ESXi hosts or vcenters over the vsphere API. It is meant as a replacement of check_vmware_esx/check_esx3 and the like. They are written in perl and VMware has deprecated the perl API. So this one ...
check_vsan
This is a pure bash/curl/grep/perl plugin for nagios to check health of VSAN clusters. It uses no vmware SDK, just pure unix tools. There is also python implementation which uses the VMware python SDK, but it didn't work for me. This plugin can pars ...


