
Search Exchange
Search All Sites
Nagios Live Webinars
Let our experts show you how Nagios can help your organization.Login
 New Listings
Directory Tree
Directory
Search Results
The search results below show both sub-categories and individual listings that match your search criteria.
Meet The New Nagios Core Services Platform
Built on over 25 years of monitoring experience, the Nagios Core Services Platform provides insightful monitoring dashboards, time-saving monitoring wizards, and unmatched ease of use. Use it for free indefinitely.
Monitoring Made Magically Better
- Nagios Core on Overdrive
- Powerful Monitoring Dashboards
- Time-Saving Configuration Wizards
- Open Source Powered Monitoring On Steroids
- And So Much More!
Submit Your Nagios Project!
Help build Nagios Exchange for yourself and the entire the Nagios Community by your Nagios project to the site. It's easy - just create an account, login, and add a new listing. Read the FAQ for instructions.Nimble Storage Replication Health API Check Script
The script utilises the Nimble Storage API to monitor the state of any lagged volumes, i.e. replicas that are still in a copying state. The user can specify when a lagged volume breaches a specific threshold in seconds to generate an error. Its normal for ...
Nimble Storage Hardware Pool Disk Space API Check Scrip...
The script utilises the Nimble Storage API to provide some basic disk space usage monitoring. Although the Nimble Storage alerting system via Infosight is very good, we all know the warm fuzzy feeling of seeing a nice green service status in NagiosXI. The ...
Nimble Storage Hardware Health API Check Script
The script utilises the Nimble Storage API to provide some basic hardware status monitoring. Although the Nimble Storage alerting system via Infosight is very good, we all know the warm fuzzy feeling of seeing a nice green service status in NagiosXI. The ...
Nicholas Scott - Nagios Performance Tuning
This presentation covers methods for monitoring and improving the performance of your Nagios servers - including use of caching, RAM disks, passive checks, and database optimization.
NEXSM
 NEXSM — Nagios EXtended Status Map — is a Java Web Start Application for visualizing the status of hosts and services being monitored by Nagios it uses JUNG for rendering the graph of objects and QDXML to parse the XML data sent by php scripts.
Newtest2Nagios
![]() Newtest is a unique source of information when it comes to performance analytics or troubleshooting application crashes. Adding Newtest to your existing Nagios installation greatly enhances traditional IT Ops analysis, providing unique correlation between ...
Newtest is a unique source of information when it comes to performance analytics or troubleshooting application crashes. Adding Newtest to your existing Nagios installation greatly enhances traditional IT Ops analysis, providing unique correlation between ...
Networker saveset checker
![]() Python script that uses the mminfo binary on the nagios server to check the status of the last
day savesets on the networker server. If the saveset is older than 1 day the status ist critical.
If no savesets for the client are reported, the check will b ...
Python script that uses the mminfo binary on the nagios server to check the status of the last
day savesets on the networker server. If the saveset is older than 1 day the status ist critical.
If no savesets for the client are reported, the check will b ...
Network Switch And Router Monitoring Wizard
![]() This Nagios XI wizard allows you to monitoring network switch and router port status and bandwidth.
This Nagios XI wizard allows you to monitoring network switch and router port status and bandwidth.
Network Security Toolkit
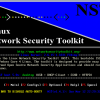 Network Security Toolkit (NST) is a bootable ISO live CD/DVD is based on Fedora. The toolkit was designed to provide easy access to best-of-breed Open Source Network Security Applications (including Nagios) and should run on most x86 platforms.
Network Replay Component
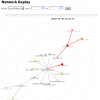 This component adds a network replay report to Nagios XI. The replay reports allows you to quickly visualize the changing state of your network over time. The report allows you to specify custom start and end times and supports dynamic updates via ajax, ...
Network monitoring with Nagios and other tools
 Nagios Presentation from 19 July 2006 Meeting.
Network monitoring with Nagios and OpenBSD
Learn how to monitor your network with Nagios and OpenBSD!
Network Monitoring with Nagios
 This presentation discusses using Nagios in an academic environment to monitor servers, detect network problems, and alert administrators to problems before the user population is affected.
Network Monitoring with Nagios
Learn how to monitor your network with Nagios!
Network and System Monitoring with Nagios and Cacti
 Boise Code Camp Presentation
Network Analyzer – Hardware Recommendations
This document is intended to provide general guidelines on the hardware requirements needed to run Nagios Network Analyzer. This document is intended for use by admins who wants to know what kind of resources they would need for setting up a Nagios Net ...
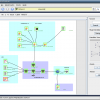
NetMap4Nagios
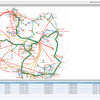 Create your own network diagram of live monitoring hosts and services. NetMap4Nagios is a visualization addon for Nagios and front-end for system Nagios. It is easy to use. You can import hostgroups and servicegroups from Nagios, create customer map of ne ...
netcat-port-check
Nagios telnet to a port check (Linux) ./telnet-check.sh localhost 80 Connection to localhost 80 port [tcp/http] succeeded!|time=0.011741s;;;0 ./telnet-check.sh localhost 22 Connection to localhost 22 port [tcp/ssh] succeeded!|time=0.012938s;;; ...
NetApp2Nagios
This is a "quick and dirty" way to get NetApp disk utilization into Nagios via the nsca add-on.
NetApp SNMP Monitoring With Nagios
This tutorial will show you how to monitor NetApp filers with Nagios.


