
Search Exchange
Search All Sites
Nagios Live Webinars
Let our experts show you how Nagios can help your organization.Login
 New Listings
Directory Tree
Directory
Search Results
The search results below show both sub-categories and individual listings that match your search criteria.
Meet The New Nagios Core Services Platform
Built on over 25 years of monitoring experience, the Nagios Core Services Platform provides insightful monitoring dashboards, time-saving monitoring wizards, and unmatched ease of use. Use it for free indefinitely.
Monitoring Made Magically Better
- Nagios Core on Overdrive
- Powerful Monitoring Dashboards
- Time-Saving Configuration Wizards
- Open Source Powered Monitoring On Steroids
- And So Much More!
Submit Your Nagios Project!
Help build Nagios Exchange for yourself and the entire the Nagios Community by your Nagios project to the site. It's easy - just create an account, login, and add a new listing. Read the FAQ for instructions.Nagios Log Server – Performance and Storage Walkthrough
This document describes requirements and performance needs such as disk space, memory, processor speed for Nagios Log Server based on cluster size and the amount of log data read per day. This document is intended for use by Nagios Log Server Administrat ...
Nagios Log Server - Managing Clusters
This document describes how to manage your Nagios Log Server Clusters through the administration section. This document is intended for use by Nagios Log Server Administrators. It describes how to manage and troubleshoot Nagios Log Server Clusters.
Nagios Log Server - Adding Additional Instances To Clus...
This document describes how to manually install an additional instance to an existing Nagios Log Server cluster from source on a clean system. These directions assume that you are using a current version of a RHEL compatible system. Nagios Log Server is s ...
Monitoringplug
My collection of monitoring plugins for Nagios and similar monitoring systems. Contains a broad range of plugins for monitor thinks like: CUPS, libVirt, NFS/SUN-RPC, RedHat Cluster, DNSSEC, RedHat Satelite, SELinux, QNap Storage, tftp, SSL, Areca Raid, Ko ...
membase_stats
This python script connects to the membase cluster and exports the metrics that are passed as the parameter. It's used by AppFirst Monitoring tool to monitor Membase cluster and correlate with other system metrics, or resource usage. Example: python ...
MarkLogic Plugin for Nagios
The MarkLogic Plugin for Nagios gives administrators a central place to manage all of their infrastructure, leveraging their organization's existing processes, tools, and knowledge to reduce costs. By integrating seamlessly into Nagios, the plugin allows ...
kubernetes-nagios
Some checks for Kubernetes clusters, that can be configured to use an external shell script.
isilon_quota_check
isilon_quota_check.pl - Checks the disk quotas usage on a EMC Isilon cluster. Detailed documentation can be found at https://github.com/throwsb/nagios-checks/blob/master/check_isilon.md
HPC Mini Cluster Monitoring with Ganglia and Nagios2
 HPC Mini Cluster Monitoring with Ganglia and Nagios 2.
HP Lefthand Volume Size check
This script, building upon the existing https://exchange.nagios.org/directory/Plugins/Hardware/Storage-Systems/SAN-and-NAS/HP-Lefthand-P4000-Cluster-Volume-check/details plugin checks individual volumes and returns a percentage used. A small amount of wo ...
HP Lefthand P4000 Cluster Volume check
Check with sh script the used space for the total Cluster Volume for a HP Lefthand P4500. Tested with 1 cluster volume and calculate the % of usage.
Elasticsearch cluster status
Plugin checks Elasticsearch cluster health using cluster health API (http://www.elasticsearch.org/guide/en/elasticsearch/reference/current/cluster-health.html) Command line parameters are: --ip - Elasticsearch server ip to check --port - Elasticsearc ...
Design, Development and Improvement of Nagios System Mo...
This document describes the work of design, development and improvement of the Nagios monitoring system done in Cineca and used for the Tier-1 systems participating in the PRACE projects. Starting from the issues arisen by the complexity of the HPC system ...
Dell Powervault MD38 Series Performance
This script reports the performance of virtual disk arrays of Dell Powervault MD38 Series, but in principle it should work with MD34 Series. Prerequisites: smcli on a windows machine and a Nagios compatible agent Version 0.1 This script uses smcli t ...
Dell EMC Isilon - Hardware Health Check Script
The script utilises the Dell EMC Isilon REST API to collect and display Cluster Health and basic node state information. It is recommended to create a read-only account on the Nimble Storage array(s), this can be AD/LDAP or local. The script is written ...
Dell ECS Health Plugin
The Dell ECS Health Check Plugin queries the Dell ECS API to obtain health information. It is designed to be pointed at a single cluster, but use of multiple checks for each cluster can be created for federation and geo-replication configuration. It is ...
Dell ECS Capacity Check Plugin
The Dell ECS Capacity Check Plugin queries the Dell ECS API to obtain usage information. It can be pointed at a single ECS cluster or multiple clusters depending on your federation and geo-replication configuration. It is strongly recommended to create a ...
Cluster Fortigates
This version allows you to monitore a cluster of Fortigate Firewalls with snmp protocol.
Cloudviewer (for VMWare vCenter)
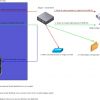 Check_MK like Plugin for VMware vCenter.
Splitted in two parts:
cloudviewer-reloader.pl:
Reads all Clusters,Hosts,VMs and Datastores from the given VC and creates Nagios Objects for it. This has to be run as a cronjob.
cloudviewer.pl:
Reads you ...
Check_MK like Plugin for VMware vCenter.
Splitted in two parts:
cloudviewer-reloader.pl:
Reads all Clusters,Hosts,VMs and Datastores from the given VC and creates Nagios Objects for it. This has to be run as a cronjob.
cloudviewer.pl:
Reads you ...


