
Search Exchange
Search All Sites
Nagios Live Webinars
Let our experts show you how Nagios can help your organization.Login
 New Listings
Directory Tree
McAfee Web Gateway Dashboard
Current Version
1
Last Release Date
2014-12-30
Compatible With
- Nagios Log Server
Owner
License
GPL
Hits
23375
Files:
| File | Description |
|---|---|
| Installation Directions.txt | Directions that you need to follow |
| Mcafee Web Access-1419900928984 | Dashboard for Nagios Log File Server |
| NagiosLogServer_v1.xml | McAfee Web Gateway Log Definition |

Meet The New Nagios Core Services Platform
Built on over 25 years of monitoring experience, the Nagios Core Services Platform provides insightful monitoring dashboards, time-saving monitoring wizards, and unmatched ease of use. Use it for free indefinitely.
Monitoring Made Magically Better
- Nagios Core on Overdrive
- Powerful Monitoring Dashboards
- Time-Saving Configuration Wizards
- Open Source Powered Monitoring On Steroids
- And So Much More!
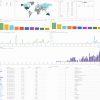
This dashboard is very handy, it has been developed to fill a specific need. That need is a place to at a glance see the performance of multiple internet connections which are being filtered by McAfee Web Access gateways.
You can use the power of Nagios Log server to quickly drill down into the masses of data that you have collected to see issues with users, latency and transferred data
This dashboard could be set to display in a NOC for a brilliant display.
You can use the power of Nagios Log server to quickly drill down into the masses of data that you have collected to see issues with users, latency and transferred data
This dashboard could be set to display in a NOC for a brilliant display.
Reviews (1)
byeloyd, January 6, 2015
I can't actually test this, but it looks great for a special niche. I imagine this could go hand-in-hand with a Nagios Network Analyzer info graphic as well.
The only thing I would change is the histograms. Assuming they are top source/destinations, I'd do a donut graph (or pie chart) instead and let the user hover for more details. It's easier on the eyes for fast visualization.
And yes, Sean, I'm serious. :-)
The only thing I would change is the histograms. Assuming they are top source/destinations, I'd do a donut graph (or pie chart) instead and let the user hover for more details. It's easier on the eyes for fast visualization.
And yes, Sean, I'm serious. :-)


