
Search Exchange
Search All Sites
Nagios Live Webinars
Let our experts show you how Nagios can help your organization.Login
 New Listings
Directory Tree
Directory
Search Results
The search results below show both sub-categories and individual listings that match your search criteria.
Meet The New Nagios Core Services Platform
Built on over 25 years of monitoring experience, the Nagios Core Services Platform provides insightful monitoring dashboards, time-saving monitoring wizards, and unmatched ease of use. Use it for free indefinitely.
Monitoring Made Magically Better
- Nagios Core on Overdrive
- Powerful Monitoring Dashboards
- Time-Saving Configuration Wizards
- Open Source Powered Monitoring On Steroids
- And So Much More!
Submit Your Nagios Project!
Help build Nagios Exchange for yourself and the entire the Nagios Community by your Nagios project to the site. It's easy - just create an account, login, and add a new listing. Read the FAQ for instructions.Customizing The Nagios XI Landing Page
This document describes how to customize the landing page that users see when they initially login to the Nagios® XI™ web interface. One of the benefits of Nagios XI is the flexibility to customize the information users see in the web interface. Custom ...
Custom URL Dashlet for Fusion
Define your own URL, dimensions, and opacity in this highly flexible dashlet!
Custom URL Dashlet
 Define your own URL, dimensions, and opacity in this highly flexible dashlet!
Custom Logo XI Component
This component allows admins to specify a custom logo and URL in the header of the Nagios XI interface. Useful for co-branding or custom branding of the monitoring app.
Current Load - HP-UX performance data fix for pnp4nagio...
The plugins I have for hp-ux are not according to standards and does not produce performance data. I wrote this little script to add performance data so that I could graph with pnp4nagios.
Currency Rate Monitoring Script
A really neat plugin that will monitor and graph currency exchange values. By Felipe Ferreira.
CURL check script
Check HTTP pages by CURL libraries. Written in PHP.
cups queue sh
Small script to locally check the queue of cups printers.
CSV Output for Nagios 2.x Availability Reports
A Patch for Nagios 2.2 avail.c, to create CSV Output for all Availability Reports. Based on the Nagios 1.2 avail.c Patch provided by Michael Medin.
Creating Nagios Plugins Using Python
If you use Nagios to monitor your servers, like just about everyone else on the planet, you should learn how to create Nagios plugins using Python.
Creating Custom TCP Monitors In Nagios
In this article you will learn how to create a custom checks in Nagios.
create_ticket.pl - RT Integration
A Perl script that will create tickets in RT when an Alarm is acknowledged in Nagios.
Create Ticket in RT
This script will create a ticket in RT (which is essentially running on a separate server than the one that runs Nagios) when an alarm is acknowledged.
Create Nagios Icons
This is a very short tutorial that shows you how to create your own Nagios icons.
Create a new Nagios IM incident
This action can be added into Nagios Reactor to create a new incident with the Nagios Incident Manager.
Create a new event chain
This action can be added into Nagios Reactor to create a new event chain as defined by a JSON file.
CPU usage for Solaris, Linux and Windows
 - Get the CPU Usage for Windows, Solaris and Linux servers.
- Works automatically for an unlimited number of CPUs
- Perfomance data can be graphed with pnp4nagios using the template.
- Works automatically for MS Windows, Solaris and Linux servers
By M ...
- Get the CPU Usage for Windows, Solaris and Linux servers.
- Works automatically for an unlimited number of CPUs
- Perfomance data can be graphed with pnp4nagios using the template.
- Works automatically for MS Windows, Solaris and Linux servers
By M ...
CPU Stats/Memory Used Plugin - Top 5 CPU/Memory Consumi...
 Returns the CPU Stats & Memory Used for all unix servers (tested on HPUX, should work on all), with Top 5 CPU or Memory consuming process details like ProcessID, ProcessName, CPU% or MemKB(used). Very useful when you got an alert from Nagios or an integra ...
cpu load plugin
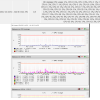
This is an initial effort to write a plugin that looks at the no. cores on the host to set the CRITICAL, WARNING and OK thresholds. The plugin also graphs the 1, 5 and 15 minute averages.
CPU core usage
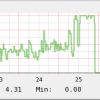 I wasnt really satisified with the way cpu utilization was shown so I wanted to graph the utilizations of the CPU cores on my linux servers. This may work on other unixes that support mpstat but it has not been tested.


