
Search Exchange
Search All Sites
Nagios Live Webinars
Let our experts show you how Nagios can help your organization.Login
 New Listings
Directory Tree
Directory
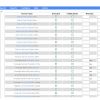
Search Results
The search results below show both sub-categories and individual listings that match your search criteria.
Meet The New Nagios Core Services Platform
Built on over 25 years of monitoring experience, the Nagios Core Services Platform provides insightful monitoring dashboards, time-saving monitoring wizards, and unmatched ease of use. Use it for free indefinitely.
Monitoring Made Magically Better
- Nagios Core on Overdrive
- Powerful Monitoring Dashboards
- Time-Saving Configuration Wizards
- Open Source Powered Monitoring On Steroids
- And So Much More!
Submit Your Nagios Project!
Help build Nagios Exchange for yourself and the entire the Nagios Community by your Nagios project to the site. It's easy - just create an account, login, and add a new listing. Read the FAQ for instructions.Nagiostats Wizard
 This wizard automatically generates checks for Nagios statistics (nagiostats), including; host/service checks per minute, check latency, execution time, external command usage, and more.
nagiostat
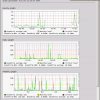 Nagiostat parses performance-data from Nagios and generates graphs of trends over time. Nagiostat makes use of RRD-tool. It then generates graphs on-the-fly through a CGI-script and HTML-templates. Nagiostat is written in perl.
Nagios stats with graphs (nagiostats)
The script checks Nagios statistics from the nagiostats commands and reports perf data. I have created a pnp4nagios template which reports the following: - Graph 1 - Service status -> No. services in downtime -> No. services in warning -> No ...
iostat nagios plugin
Check disk io
Iostat - check_tps
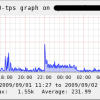 Nagios plugin/script to check the disk statistic TPS aka IOPS on a Linux machine. I also included a | after the output for performance statistics.
Usage:
Usage: check_tps.sh [-w|--warning] [-c|--critical]
[root@foobar libexec]# ./check_tps.sh -w 20 ...
Nagios plugin/script to check the disk statistic TPS aka IOPS on a Linux machine. I also included a | after the output for performance statistics.
Usage:
Usage: check_tps.sh [-w|--warning] [-c|--critical]
[root@foobar libexec]# ./check_tps.sh -w 20 ...
check_nagiostats.pl (Advanced Nagios Plugins Collection...
Shows the Nagios stats with perfdata for graphing purposes
check_nagiostats
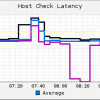 This plugin checks nagios performance data by parsing the nagios status.dat file, which is expected to be located at
"/usr/local/nagios/var/status.dat".
This version runs stable with host and service latency check on my nagios 3.2.2. Anyway, this plu ...
This plugin checks nagios performance data by parsing the nagios status.dat file, which is expected to be located at
"/usr/local/nagios/var/status.dat".
This version runs stable with host and service latency check on my nagios 3.2.2. Anyway, this plu ...
check_mk_iostat_extended
This is a plugin i wrote for the CHECK_MK. It parse output of IOSTAT and present it in the format acceptable for CHECK_MK. I recommend to cron it and output all to a file, and cat this file using CHECK_MK local check - it uses IOSTAT 2sec interval to ge ...
check_iostat - I/O statistics - updated 2016
This is an updated version of: http://exchange.nagios.org/directory/Plugins/Operating-Systems/Linux/check_iostat--2D-I-2FO-statistics/details - await added - bugs fixed including now reports current values instead of - average since boot. - pnp4nagio ...
check_iostat - I/O statistics
This plugin shows the I/O usage of the specified disk, using the iostat external program. It prints three statistics: Transactions per second (tps), Kilobytes per second read from the disk (KB_read/s) and and written to the disk (KB_written/s)
check_disk_util.sh
This Plugin allows to check disk utilization on hard disks. It uses iostat -x. Examples: check_disk_util -w 80 -c 90 -d sda Checks /dev/sda* at 80% and 90% of disk utilization OK: sda disk utilization 2.52% OK: sda1 disk utilization 0.00% O ...
check_disk_iostat
Windows NRPE plugin for disks performance monitoring. Return Name, AvgDiskQueueLength, DiskReadBytesPersec, DiskWriteBytesPersec, PercentDiskTime. Check AvgDiskQueueLength parameter to warning/critical levels.
check_disk_detail
Checks Disk Space, Busy Time, Service Time, Byte Reads/Writes. Pass in a directory name, and it will check the space, and return iostat info. Uses iostat and df...very Solaris specific.
check_cpu_stats.sh
Nagios plugin (script) to check CPU Utilization Statistics (user,system,iowait,idle,nice and steal %) with iostat external program
check_cpu_stats fixed
Nagios plugin (script) to check CPU Utilization Statistics (user,system,iowait,idle and nice,steal when available in %) with iostat external program reporting performance data
check_cpu.sh (matejunkie)
sh compliant script to check CPU utilization via /proc/stat instead of top or iostat (PNP template included)
check_cpu.sh
This shell script checks cpu utilization (user,system,iowait,idle in %) with iostat accepting seperate threshholds and returning the data in a format suitable for performance data processing
Check Iostat Updated
An updated version of this plugin: http://exchange.nagios.org/directory/Plugins/Operating-Systems/Linux/check_iostat--2D-I-2FO-statistics/details With support for newest iostat and other features
Check IO Wait (by Nestor@Toronto)
Check IO Wait for Linux. Return IO wait in percentage Script were written in BASH, tested on CentOS 6.X, Nagios 3.X # Dependency: iostat


