
Search Exchange
Search All Sites
Nagios Live Webinars
Let our experts show you how Nagios can help your organization.Login
 New Listings
Directory Tree
Directory
Search Results
The search results below show both sub-categories and individual listings that match your search criteria.
Meet The New Nagios Core Services Platform
Built on over 25 years of monitoring experience, the Nagios Core Services Platform provides insightful monitoring dashboards, time-saving monitoring wizards, and unmatched ease of use. Use it for free indefinitely.
Monitoring Made Magically Better
- Nagios Core on Overdrive
- Powerful Monitoring Dashboards
- Time-Saving Configuration Wizards
- Open Source Powered Monitoring On Steroids
- And So Much More!
Submit Your Nagios Project!
Help build Nagios Exchange for yourself and the entire the Nagios Community by your Nagios project to the site. It's easy - just create an account, login, and add a new listing. Read the FAQ for instructions.check_proc_mem
![]() A Simple Windows Plugin to display the Total Process Memory consumed by a single/multiple processors. It also displays valuable performance data.
A Simple Windows Plugin to display the Total Process Memory consumed by a single/multiple processors. It also displays valuable performance data.
check_proc_fd.sh: check process memory usage
 Check fd count opened by a given process
Check more: https://www.dennyzhang.com/nagois_monitor_process_fd
Check fd count opened by a given process
Check more: https://www.dennyzhang.com/nagois_monitor_process_fd
check_procmemtotal
 The purpose of this program is to calculate totam memory usage for a set of processes.
Example can be tracking of a memory consumption for httpd apache processes. Those processes
are forked into many instances. Our program looks for every pid that corre ...
The purpose of this program is to calculate totam memory usage for a set of processes.
Example can be tracking of a memory consumption for httpd apache processes. Those processes
are forked into many instances. Our program looks for every pid that corre ...
check_pfsense (numerous checks)
 This is a collection of scripts I've put together over the years for monitoring pfSense. I used them as a check via SSH proxy, but you could use them via NRPE as well. The Linux Included website has an in-depth discussion on how the various checks work. I ...
check_passenger_memory_stats_passenger_processes_total_...
Check passenger memory stats, specifically for Passenger processes total private dirty.
check_passenger_memory_stats_passenger_processes_rails_...
Check passenger memory stats, specifically for Passenger processes Rails VMSize sum.
check_passenger_memory_stats_passenger_processes_rails_...
Check passenger memory stats, specifically for Passenger processes Rails VMSize max.
check_passenger_memory_stats_passenger_processes_rails_...
Check passenger memory stats, specifically for Passenger processes Rails count.
check_passenger_memory_stats_apache_processes_total_pri...
Check passenger memory stats, specifically for Apache processes total private dirty.
check_passenger_memory_stats_apache_processes_apache2_v...
Check passenger memory stats, specifically for Apache processes apache2 sum.
check_passenger_memory_stats_apache_processes_apache2_v...
Check passenger memory stats, specifically for Apache processes apache2 VMSize max.
check_passenger_memory_stats_apache_processes_apache2_c...
Check passenger memory stats, specifically for Apache processes apache2 count.
check_passenger_memory_stats_apache_processes_apache2_c...
Check passenger memory stats, specifically for Apache processes apache2 count.
check_passenger
Nagios check command to monitor running Passenger processes and the memory that they use. It can report data on a global or per-application basis, and raise warnings and alerts when consumption exceeds given thresholds.
check_oracle_health
 check_oracle_health is a plugin for the Nagios monitoring software that allows you to monitor various metrics of an Oracle database. It includes connection time, SGA data buffer hit ratio, SGA library cache hit ratio, SGA dictionary cache hit ratio, SGA s ...
check_oom_killer
Look for the 'Out of memory' string in the /var/log/kern.log file. Its presence indicates the OOM Killer was activated. For more information: http://en.wikipedia.org/wiki/Out_of_memory
check_nwc_health
check_nwc_health is a plugin which is used to monitor network components. Use it to monitor devices like Cisco IOS, Cisco Nexus, F5 BIG-IP, CheckPoint Firewall1, Juniper NetScreen, HP Procurve, Nortel, Brocade 4100/4900, EMC DS 4700, EMC DS 24, Allied Tel ...
check_nvidiasmi.sh
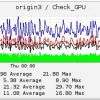 check nvidia GPU utilization
/usr/local/bin/check_nvidiasmi.sh
OK GPU - 32%; Memory - 12%; Encoder - 53%; Decoder - 23% | gpu=32% memory=12% encoder=53% decoder=23%
pnp4nagios template check_nvidiasmi.php
check nvidia GPU utilization
/usr/local/bin/check_nvidiasmi.sh
OK GPU - 32%; Memory - 12%; Encoder - 53%; Decoder - 23% | gpu=32% memory=12% encoder=53% decoder=23%
pnp4nagios template check_nvidiasmi.php
check_netscreen_mem
Checks the memory usage on Netscreen/Juniper Firewalls


