Search Exchange
Search All Sites
Nagios Live Webinars
Let our experts show you how Nagios can help your organization.Login
Directory Tree
check_iftraffic64
- Nagios 1.x
- Nagios 2.x
- Nagios 3.x
- Nagios 4.x
- Nagios XI
| File | Description |
|---|---|
| check_iftraffic64.pl | Check plugin |
| check_net_status.php | PNP4Nagios template. |
Check_iftraffic64 is an updated version of (check_iftraffic3) and has been changed to use 64 bit SNMP counters but can still handle 32 bit. Some math issues found in check_iftraffic3 were resolved as well.
Version .77: There are no functionality changes with this release. I simply fixed some code comments (spelling errors, removed spurious comments, etc.)
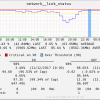
I also uploaded a PNP4Nagios template for the plugin. It provides the following features. Put this file in the /usr/local/pnp4nagios/share/templates/ directory. See uploaded examples.
1. It converts the performance data from the Nagios plugin standard (Bytes) to bits, however, the graph is percent based, bits are listed in the text of the legend not on the graph itself.
2. Peak - Prints the timestamp of when your peak traffic during the graph period happened.
3. Rem Peak Cap - Calculates remaining capacity or headroom (how much bandwidth is left between your peak traffic and your critical threshold).
4. Rem Ave Cap - Calculates remaining capacity or headroom (how much bandwidth is left between your average traffic and your critical threshold).
5. Total Bytes - Displays the total amount of data that has crossed the interface during the graphed period.
6. Min over Thresh - Displays how much time during the graphed period traffic was above the critical threshold.
7. Times over Thresh - Counts and displays how many times the critical threshold was crossed during the graphed period.
Version .76: Thanks to Mark Rittinghaus for pointing out and recommending solutions to a couple of bugs in the perfdata. These have been addressed in this release. This release changes the units for the in_ave/out_ave perfdata from bits (if you specify bits on the command line) to Bytes and changes inAbsolut/outAbsolut from Bytes to Continuous. Both of these changes may disrupt your perfdata graphing if you use PNP4Nagios (RRD). It does not affect the in_ave_pct/out_ave_pct perfdata output.
Version .75:
Thanks to Philip Ho
Version .74:
Thanks to the help of Rogerio Tomassoni de Araujo Junior we now have SNMPv3 support! The check can use three v3 levels (NoauthNoPriv, authNoPriv, and authpriv). You can also specify the Auth method (MD5 or SHA) and or the encryption method (DES, AES, or 3DES). Thanks Rogerio!
Version .73:
Fixed a couple of bugs, they are listed in the comments at the top of the script.
Version .7:
The check script now has an 64|32 bit auto detection, you can also force 64 or 32 bit on the cmd line. Added logic to handle invalid interface speed results (thanks Mathieu GRZYBEK).
Version .6:
I've removed text from the output that was not necessary. Thanks Nicholas Coulin for pointing it out.
Version .5:
Significant features in this check include the following:
1. Capable of handling 32 and 64 (default) bit SNMP counters
2. Auto detects max bandwidth (unless specified)
3. Supports asymetric links, i.e. Ability to specify different BW limits (in and out) other than what is automatically detected. Good for Internet connections that have different up and down speeds
4. NagVis weathermap line compatible perfdata output
5. Returns CRITICAL status when the interface is down.
examples:
# Simple 64 bit check of interface used as the primary host interface (based on IP address of host1)
check_iftraffic64.pl -H host1 -C sneaky
# 32 bit mode check of interface index 5 in bits/s with 100m bandwidth limit
check_iftraffic64.pl -H host1 -C sneaky -i 5 -B -b 100 -u m --32bit
# Check of interface using address 192.168.1.1 in bits/s running 50m down (in) and 10m up (out)
check_iftraffic64.pl -H host1 -C sneaky -A 192.168.1.1 -B -I 50 -O 10 -u m
Just one small bug. The following line is executed without debug mode being requested:
print "$ifdescr = $key / $snmpkey \n"; #debug
For me, this results in the first line of the status text to be:
eth0 = 1.3.6.1.2.1.2.2.1.2.2 / 2
and the following actual lines aren't displayed in the host service list (Service Status Details For Host), only when drilling down to the specific service (Service State Information).
I've just commented out the line above, and the script no longer outputs the interface name and OID.
Hi,
Thanks for pointing this out. The bug has been fixed, thanks to Gerhard M. who also reported this bug.
-greg
-b 100 display the help, same for --bandwidth 100 or 10 or 1 or 1000
The -b switch does require an argument, it also requires the -u switch which specifies the units. For example you would do some thing like: '-b 100 -u m' for an interface speed of 100mb.
Regards
Domen
Hi domensetar,
The check does not intentionally discriminate against Brocade. It is using standard SNMP API's in perl to query the end devices. I'm not sure why they don't work. We don't use Brocade devices here, nor do i have any to test with. If you are still trying to resolve this you could send me an example of the errors you are getting, I may be able to figure it out.
-greg
"Illegal division by zero at ./check_iftraffic64.pl line 427" when runing in console
"Return code of 25 is out of bounds" when used in nagios
I believe the "Illegal division" issue has been fixed. The other one however, 'Return code of 25..." has not been resolved. I have been unable to track it down but suspect it has something to do with the nagios host not able to open any more network connections for the script. We see that one in our environment but it is intermittent. I don't understand the relationship between the perl interpreter and the network sockets ona machine, is there a limit to how many a process can open? I may be way off on this.
Also if you are having issues with "error code 13 out of bounds" you probably tested it with root user on command line first, which creates a 'traffic' folder in the 'libexec' folder with root ownership, change owner and or group to your nagios user to fix this.
I agree that SNMPv3 should be added to make the check more complete. Currently this is not a requirement by my employer, until that changes I won't have any cycles to offer in that regard. If you want to add that functionality, I would upload it here.
Regards,
-greg


 New Listings


