
Search Exchange
Search All Sites
Nagios Live Webinars
Let our experts show you how Nagios can help your organization.Login
 New Listings
Directory Tree
Directory
nicola.sarobba
bynicola.sarobba, February 13, 2015
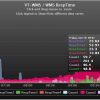
I also got the famous "blank page", because
I run Apache with SSL and Firefox blocks mixed content: modify line 150 of highcharts.html from http to https and you can see the graph.
bynicola.sarobba, July 4, 2012
I think there is a problem with the exit codes.
The exit status of a Nagios plugin should be 0=OK, 1=WARNING, 2=CRITICAL, or 3=UNKNOWN, but if the plugin is not run as zimbra user or if the zmcontrol executable is not found the exit code is 0 (OK).
The exit status of a Nagios plugin should be 0=OK, 1=WARNING, 2=CRITICAL, or 3=UNKNOWN, but if the plugin is not run as zimbra user or if the zmcontrol executable is not found the exit code is 0 (OK).
bynicola.sarobba, May 28, 2012
It's not possible to monitor NetApp FAS systems. I get the error: "[ERROR] Could not read ifOctetIn information from host "x.y.z.q" with snmp".
This post explains why.
http://www.tontonitch.com/phpbb/viewtopic.php?f=2&t=1669
Owner's reply
Full support of NetApp Filers is implemented and will be available in the next release of the plugin (0.05)
Thanks for the feedback.
bynicola.sarobba, May 24, 2012
If you do not want to use the root account, but a dedicated account for monitoring, you can try this steps:
in vSphere
- create a nagios user
- add this user to the root group
- Assign the "No access" role to the nagios user
Youll'have the right to access from the plugin, but the nagios user will not be able to access with the vsphere client, the console and, SSH.
bynicola.sarobba, January 19, 2012
The plugin works fine with ESXi 4.1 (the new licensed version).
If you do not want to use the root account, but a dedicated account for monitoring, you can try this steps:
in vSphere
- create a nagios user
- add this user to the root group
- Assign the "No access" role to the nagios user
Youll'have the right to access from the plugin, but the nagios user will not be able to access with the vsphere client, the console and, SSH.
Connecting with the perl Sybase module can be somewhat tricky.
I finally got a succesfull connection this way:
1 - Edit /etc/freetds/freetds.conf
[sqlhost1]
host = 192.168.1.1
port = 1433
tds version = 8.0
2 - Use the --server command line option instead of the --hostname option:
check_mssql_health --server=sqlhost1 --username=nagiosuser --password=nagiospass --mode connected-users
bynicola.sarobba, May 27, 2010
This script is buggy. I have 9 virtual machines on my hosts and the 9th as the SNMP index 416 in the table.
The code to get the id of a machine makes the assumption that there are a 1:1 relation between the number of machines and the SNMP index.
This is the same bug present in check_snmp_cisco_ifstatus.
As stated above try this script instead: https://secure.opsera.com/svn/opsview/trunk/opsview-core/nagios-plugins/check_snmp_vmware_cpu
Beware that with ESX 4.0 you have to explicitly activate the OID 1.3.6.1.4.1.6876 and if you have already Net-SNMP running your task is to make the two SNMP agents coexist.
bynicola.sarobba, March 11, 2010
This bash script has no -h or --help switch.
The usage says: check_snmp_cisco_memfree -w limit -c limit -h host -s snmp-community
but -w means critical and -c means warning
I think that the comments in the code should be in English.
The usage says: check_snmp_cisco_memfree -w limit -c limit -h host -s snmp-community
but -w means critical and -c means warning
I think that the comments in the code should be in English.


