
Search Exchange
Search All Sites
Nagios Live Webinars
Let our experts show you how Nagios can help your organization.Login
 New Listings
Directory Tree
Interfacetable_v3t
- Nagios 2.x
- Nagios 3.x
- Nagios 4.x
- Nagios XI

Meet The New Nagios Core Services Platform
Built on over 25 years of monitoring experience, the Nagios Core Services Platform provides insightful monitoring dashboards, time-saving monitoring wizards, and unmatched ease of use. Use it for free indefinitely.
Monitoring Made Magically Better
- Nagios Core on Overdrive
- Powerful Monitoring Dashboards
- Time-Saving Configuration Wizards
- Open Source Powered Monitoring On Steroids
- And So Much More!
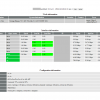
the network interfaces of a node (e.g. router, switch, server) without knowing
each interface in detail. Only the hostname (or ip address) and the snmp community string are required.
Interfacetable_v3t (formerly check_interface_table_v3t.pl) comes from:
* check_interface_table.pl: released courtesy ITdesign Software Projects & Consulting. this is the first version of the plugin, extracted from the commercial suite proposed courtesy ITdesign.
* check_interface_table_v2.pl: released courtesy NETWAYS GmbH, it adds the performance data related to bandwidth usage.
This 3rd version of the plugin includes many new features and improved functionality.
Some key highlights of this version include:
* externalization of the html page design in css stylesheets and js files
* extended interface inclusion/exclusion system
* full documentation
* code review and cleaned, following the nagios plugin development guidelines
* installer for straightforward installations and upgrades
* snmp v1/v2c/v3 supported with several snmp options available
* 64bits counters support
* error/discard packet tracking, duplex status tracking
* Juniper Netscreen extended mode (including vsys, zone and management protocols)
* more and more supported devices
* and much more ! (see changelogs)
Complete documentation: https://github.com/Tontonitch/interfacetable_v3t/blob/master/doc/00-toc.md
Changelog: https://raw.githubusercontent.com/Tontonitch/interfacetable_v3t/documentation/CHANGELOG
Support the check of the following node types: Brocade fiberchannel switches, Cisco routers, Linux hosts, Windows hosts, Solaris hosts, Netapp filers,...
Note: the previous branches (0.02, 0.03, 0.04) are still available but will be not enhanced anymore.
Note: release >=0.05-1 include nagios 4 support.
I've installed it on nagios 4, and, the status link does not appear correctly: I get http://10.0.0.0/nagios/cgi-bin/%22/interfacetable_v3t/tables/dQ2DlinkQ2Dsw-Interfacetable.html%22 instead of http://10.0.0.1/interfacetable_v3t/tables/dQ2DlinkQ2Dsw-Interfacetable.html, what is the cause of that? :S
Hi,
Please open a topic in the support part of the dedicated forum http://www.tontonitch.com/phpbb.
Please post the options used to install interfacetable_v3t.
Regards,
Yannick
works with Cisco 1800,1900,880
Dell Powerconnect 2848
But i have a problem with pnp4nagios:
PNP Error
"/usr/local/pnp4nagios/var/perfdata/XXX/Interface_Status.xml" not found.
Despite PNP4Nagios works with others plugins.
Hi pierrooo,
Thanks for the feedback.
The plugin should work correctly with pnp4nagios. Moreover, pnp4nagios is the recommended graphing solution to use with this plugin.
Also, you may use the option -h "host alias" and specify the hostname used in the nagios config. Usually, with pnp4nagios the checkcommand would start with ./check_interfacetable_v3t.pl -H $HOSTADDRESS$ -h $HOSTNAME$ ...
If you still face this problem, please go to the dedicated forum (http://www.tontonitch.com/phpbb/) and post some details about it.
Regards,
Yannick
While I'm configuring all this stuff I found some troubles that I solved by myself:
1.- 3Com Switches (2849) labels contains ", " (comma and space) and this caused broken links to pnp4nagios graphs cause XML an RRD files generated translated this sequence to "._".
To solve this I added (line 1855) the following line to "GenerateInterfaceTableData" function inside check_interface_table_v3t.pl file:
$servicename =~ s/, /\._/g;
2.- Blank characters in Nagios Hostnames are visualized as "Q20" in "Node Selector" drop down menu. I solved this adding the following line to "nodename" function inside /usr/local/interfacetable_v3t/share/tables/index.php file:
$filename = preg_replace("/(Q20)/", " ", $filename);
Hope this help somebody.
Thanx for this awesome plugin!!!
Thanks for your feedback.
I will implement your change in the next release of the plugin.
Best regards,
Yannick
It's not possible to monitor NetApp FAS systems. I get the error: "[ERROR] Could not read ifOctetIn information from host "x.y.z.q" with snmp".
This post explains why.
http://www.tontonitch.com/phpbb/viewtopic.php?f=2&t=1669
Full support of NetApp Filers is implemented and will be available in the next release of the plugin (0.05)
Thanks for the feedback.


