Search Exchange
Search All Sites
Nagios Live Webinars
Let our experts show you how Nagios can help your organization.Login
Directory Tree
Category: Network Connections, Stats and Bandwidth
Nagios plugins for monitoring network bandwidth usage, download speed, network connections, etc.
Meet The New Nagios Core Services Platform
Built on over 25 years of monitoring experience, the Nagios Core Services Platform provides insightful monitoring dashboards, time-saving monitoring wizards, and unmatched ease of use. Use it for free indefinitely.
Monitoring Made Magically Better
- Nagios Core on Overdrive
- Powerful Monitoring Dashboards
- Time-Saving Configuration Wizards
- Open Source Powered Monitoring On Steroids
- And So Much More!
Submit Your Nagios Project!
Help build Nagios Exchange for yourself and the entire the Nagios Community by your Nagios project to the site. It's easy - just create an account, login, and add a new listing. Read the FAQ for instructions.Interfacetable_v3t
 Interfacetable_v3t.pl is a Nagios(R) plugin that allows you to monitor the network interfaces of a node (e.g. router, switch, server) without knowing each interface in detail. This plugin comes from check_interface_table.pl / check_interface_table_v2.pl, ...
Juniper SRX - VPNL2L phase 1 & 2 monitor
Check if VPNL2L tunnel is established - ike or ipsec phases are up.
k0rdi
 Based on check_bandwidth.sh. Plugin for monitoring utilization of network interfaces linux. Improved traffic warning / critical status.
Linux Check PPS, BPS, or Current Line Rate % of NIC
Nagios plug-in that calculates receiving PPS, BPS, and percentage of line-rate (LR) from Linux kernel statistics by reading from procfs and notifies if above a given threshold.
lwp-download-speed
lwp-download-speed is a nagios-plugin based on the perl-download-program "lwp-download". This plugin is useful to measure the speed of a http-download.
Meraki - Check 4G Status
This plugin will query the Meraki Cloud controller and return user friendly status messages of the cellular backup connection to be displayed by the Nagios Server.
Meraki - Check Device Status
![]() This plugin will query the Meraki Cloud controller and return user friendly messages to be displayed by the Nagios Server.
This plugin will query the Meraki Cloud controller and return user friendly messages to be displayed by the Nagios Server.
Monitoring Interface Bandwidth Utilization Using Cacti ...
This Python plugin will alert when the average bandwidth utilization of a network interface exceeds the configured thresholds. It uses data that is already being captured on a remote (or local) Cacti server rather than storing data in a local database. Ma ...
Monitoring multiple IPs for single port in single servi...
This plugin is simply designed to cater requirement of monitoring TCP connection to a Port binded to various IP addresses, These IP addresses can be on a single Machine or can be on multiple machines.
MRTGBits
Do you run MRTG and NAGIOS but frustrated that NAGIOS default MRTG plugins only report as Bytes? Yeah me to. So I wrote this little opensource Nagios plugin called MRTGBits to do just that... convert the MRTG Bytes to bits for Nagios. MRTGBits can also se ...
nagios_check_listening_port_linux
nagios_check_listening_port_linux is a plugin written to verify that a specified process name can be found listening on a specified TCP port.
Network Queue
This check allows you to check for packet processing queues on TCP and UDP on unix based operation systems. It was developed and tested on RHEL/CentOS, but should be easily modifiable to be usable everywhere. UPDATED: Thanks to Hugo van der Kooij for p ...
Number of connections opened by a process
Counts number of opened connections that a given process has opened. Plugin uses netstat with sudo access. It can match process by regexp or use pid file (which is strongly recommended).
Radware - Check Linkproof - SNMP v1, v2c, v3
Check Radware Linproof - Version 1.3 (29/12/2009) > VRRP status > Next Hop Router NHR status
sgichk_san_iftraffic
Monitor traffic stats for SAN ports and pnp4nagios template
Solaris Network Utilization
Uses the nicstat utility. Used as an NRPE plugin on Solaris server, checks current network utilization over a 2 - 6 second period, averages it out and returns the value. Uses the 'nicstat' utility, **Current version can be downloaded from http://blogs.sun ...
TCP traffic degradation detection from link utilization
 This plugin estimates the TCP traffic performance degradation from coarse link utilization traces, such as those obtainable by SNMP.
thola
 A tool for monitoring and provisioning network devices written in Go. It features a check mode which complies with the monitoring plugins development guidelines and is therefore compatible with Nagios, Icinga, Zabbix, Checkmk, etc.
Watchguard Branch Office VPN Tunnels
This plugin checks if one or more of Branch Office VPN Tunnels are active on a Watchguard device.
Watchguard CPU
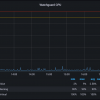 This plugin checks CPU usage of Watchguard device and returns CPU performance data.
Watchguard Gateway Antivirus and IPS last updated
This plugin checks Gateway Antivirus Service and/or Intrusion Prevention Service update time in a Watchguard device.
Watchguard Load
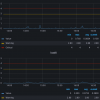 This plugin checks load of Watchguard device and returns load performance data
Watchguard Memory
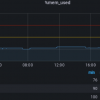 This plugin checks memory usage of Watchguard device and returns memory and swap performance data:
Watchguard Network
 This plugin checks bandwidth and connections of Watchguard device and returns performance data.
Windows User logged-in check
![]() This plugin allow to easily check how much users are logged-on a windows machine with SNMP enabled , no Agent needed.
in the .tar you can find everything needed to make this running in a minute :)
This plugin allow to easily check how much users are logged-on a windows machine with SNMP enabled , no Agent needed.
in the .tar you can find everything needed to make this running in a minute :)


 New Listings