
Search Exchange
Search All Sites
Nagios Live Webinars
Let our experts show you how Nagios can help your organization.Login
 New Listings
Directory Tree
ndo2db grapher
Current Version
0.3.2
Last Release Date
2009-02-16
Owner
Website
Hits
257999
Files:
| File | Description |
|---|---|
| ndo2db-0.3.1.tar.bz2 | ndo2db grapher v0.3.1 |
| ndographer-v0.3.2.tar.bz2 | ndographer v0.3.2 |

Meet The New Nagios Core Services Platform
Built on over 25 years of monitoring experience, the Nagios Core Services Platform provides insightful monitoring dashboards, time-saving monitoring wizards, and unmatched ease of use. Use it for free indefinitely.
Monitoring Made Magically Better
- Nagios Core on Overdrive
- Powerful Monitoring Dashboards
- Time-Saving Configuration Wizards
- Open Source Powered Monitoring On Steroids
- And So Much More!
Last version : v0.3.2 (2009/02/16)
Changelog:
* bugfix
* we are now able to select sub indicator when graphing (aka avg, min, max, crit and warn). So things are now simplier.
* disabling anti aliasing by default as Debian doesn't support it.
v0.3.1 (2009/01/28)
Changelog :
* bugfix in the javascript : now I'm using a class to handle pregenerated image.
* including directly the css directory so no more needed to download it.
This release only include bugfix if you are using pre-generated image (from v0.3).
v0.3 (2009/01/15)
Changelog :
* bugfix
* optimization by handling spited table for nagios_servicechecks (you need to split this table in multiple table named nagios_servicechecks_YYYYmmdd). This can achieve a huge difference if you have a big database. To give you an order, I got 14 Gb of data splitted into 150 tables to get 150 days of history. To do the job, you can try rotate_nagios_servicechecks.sh BUT BEWARE, USE IT AT YOUR OWN RISK !!! DO A BACKUP BEFORE LAUNCHING THIS SCRIPT AND MAKE TEST BEFORE USING IT ON A REAL PLATFORM !!!
* fix a bug (cannot store more than 255 bytes of performance data) by switching from VARCHAR255 to BLOB to store result (rotate_nagios_servicechecks.sh is handling this).
* handling of static generated graphic with generate_month_graphic.sh. This script generate png of previous day and store it in a cache directory.
You'll need to change you crontab in order to launch this script. Here's an example of what you can do :
# rotage nagios_servicechecks table. USE IT WITH CARE !!! YOU CAN LOSE YOUR DATA !!!
20 */2 * * * /path/to/nagios/scripts/rotate_nagios_servicechecks.sh> /path/to/nagios/log/rotate_servicechecks.log 2>&1
# generate static graphics
30 4 * * * /path/to/nagios/scripts/generate_month_graphic.sh> /path/to/nagios/log/generate.log 2>&1
v0.2.1 Changelog :
* generate only a graphic (using the option dump_graphic=1) to embed directly graphics in nagios web pages.
* generate cumulate area for CPU graphic
* force min and max value
* bugfix
v0.2 Changelog :
* cumulate indicators from various host
* bugfix.
v0.1
* multiple selection of various indicators
* multiple host selection
* average value
Actually, I'm only supporting MySQL backend but if someone need to support PostgreSQL, just send me an email :) (yannig_DOT_perre_AT_gmail_DOT_com)
Installation
ndoutils
First, you'll need a working ndo2db/ndoutils backend working with nagios. To install it, go fetch ndoutils here : http://sourceforge.net/project/showfiles.php?group_id=26589&package_id=173832
Compile it and install it against your version of nagios. Edit nagios config file by adding the following line :
...
# ndoutils broker
broker_module=/path/to/your/ndomodule/ndomod.o config_file=/path/to/your/ndomod/config/file/ndomod.cfg
...
Then edit your ndomod.cfg. Here's an example :
root@XXX # more ndomod.cfg
instance_name=default
#output_type=file
#output_type=tcpsocket
output_type=unixsocket
output=/path/to/your/nagios/var/ndo.sock
tcp_port=5668
output_buffer_items=50000
buffer_file=/path/to/your/nagios/var/ndomod.tmp
file_rotation_interval=14400
file_rotation_timeout=60
reconnect_interval=15
reconnect_warning_interval=15
data_processing_options=-1
config_output_options=0
Then edit you ndo2db.cfg. Here's an example :
Tune DB information
root@XXX # more ndo2db.cfg | egrep -v -e "^#" | egrep -v -e "^$"
ndo2db_user=patrol
ndo2db_group=produit
socket_type=unix
socket_name=/path/to/your/nagios/var/ndo.sock
tcp_port=5668
db_servertype=mysql
db_host=localhost
db_port=3306
db_name=nagios
db_prefix=nagios_
db_user=mysql_nagios_user
db_pass=mysql_nagios_passwd
max_timedevents_age=1440
# aka = 7 days
max_systemcommands_age=10080
# aka = 10 days
max_servicechecks_age=14400
# aka = 7 days
max_hostchecks_age=10080
max_eventhandlers_age=44640
debug_level=1
debug_verbosity=0
debug_file=/path/to/your/nagios/var/ndo.debug
max_debug_file_size=1000000
Warning ! You'll need to create an initial database containt by using mysql.sql script in db sub directory in the ndoutils package (v1.4b7).
Launch your ndo2db daemon :
/path/to/your/nagios/bin/ndo2db-3x -c /path/to/your/nagios/etc/ndo2db.cfg
Restart nagios daemon.
If you see something like this in the nagios log, then you've got a working version of ndo2db !
12xxxxxxxx ndomod: Successfully reconnected to data sink! 0 items lost, 236 queued items to flush.
12xxxxxxxx ndomod: Successfully flushed 236 queued items to data sink.
Install ndo2db grapher
Then you can try to use the ndo2db grapher. Untar ndo_graph.tar.gz then configure the mysql connection by editing nagios_graph_conf.inc.php:
$cache_directory = "/var/www/cache";
$db_host = "localhost";
$db_user = "root";
$db_pass = "";
$db_name = "nagios";
Warning : You will need the presence of jpgraph at the same level as the php pages (download it at this location : http://www.aditus.nu/jpgraph/).
Then edit the default generic-service to add the following elements:
define service {
name generic-service
...
notes Graph
notes_url /display_nagios_info.php?name1=$HOSTNAME$&name2=$SERVICEDESC$
...
}
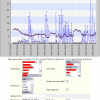
Even better, (version major or equal to v0.2.1) you can embed directly a graphic in nagios pages (see screenshot) :
define service {
name generic-service
...
notes
notes_url /display_nagios_info.php?name1=$HOSTNAME$&name2=$SERVICEDESC$
...
}
http://www.nagiosexchange.org/cgi-bin/jump.cgi?ID=1574&view=File9;d=1
You will see a nice icon in nagios which let you display nice graphics from the ndo2db backend.
Note for omegax and brn : Thanks for your report, I'll take a look at your advices.
Reviews (1)
byjotagera, February 18, 2011
This code is so good.
Simple to install and very useful
Simple to install and very useful


