
Search Exchange
Search All Sites
Nagios Live Webinars
Let our experts show you how Nagios can help your organization.Login
 New Listings
Directory Tree
check_linux_stats Featured
- Nagios 2.x
- Nagios 3.x
- Nagios 4.x
- Nagios XI
| File | Description |
|---|---|
| check_linux_stats.pl | check_linux_stats |
| nrpe.cfg.sample | nrpe.cfg.sample |

Meet The New Nagios Core Services Platform
Built on over 25 years of monitoring experience, the Nagios Core Services Platform provides insightful monitoring dashboards, time-saving monitoring wizards, and unmatched ease of use. Use it for free indefinitely.
Monitoring Made Magically Better
- Nagios Core on Overdrive
- Powerful Monitoring Dashboards
- Time-Saving Configuration Wizards
- Open Source Powered Monitoring On Steroids
- And So Much More!
A perl plugin using Sys::Statistics::Linux
Thanks to Jonny Schulz, the author of Sys::Statistics::Linux, for his great work (http://search.cpan.org/~bloonix/) !
v1.2 Changelog :
- Add Paging statistics
- Add swapused and active memory on perfparse statistics
- Remove unused -H option (mthuijs)
v1.3 Changelog :
- Add uptime check, warning threshold in minutes (csterley)
- Replace /usr/local/nagios/libexec with FindBin (eulen)
- Fix reports network traffic in bytes (dbsanders)
v1.4 Changelog :
- Illegal division by zero (helium_rday, RedFish)
- Get the cache out of the used memory (waterdeep, dbsanders)
- Removed unused $return_str on check io disk (RedFish)
- Add steal cpu statistics
v1.5 Changelog :
- Add paging statistics to check for major faults (kevin@candidsource.com)
- bug, when using unit=MB for disk usage, the perf data writtens only KB (john12)
- Bug, multiple pipe on IO perfcournter (ledistordu)
- Add CPU context switch statistics
-h, --help
print this help message
-C, --cpu
check cpu usage
-P, --proc
check the processes number
-M, --memory
check memory usage (memory used, swap used and memory cached)
-N, --network=NETWORK USAGE
check network usage in resq or bytes (default bytes)
-D, --disk=DISK USAGE
check disk usage
-I, --io=DISK IO USAGE
check disk I/O (r/w on /dev/sd*)
-L, --load=LOAD AVERAGE
check load average
-F, --file=FILE STATS
check open files (file alloc, inode alloc)
-S, --socket=SOCKET STATS
socket usage (tcp, udp, raw)
-W, --paging=PAGING AND SWAPPING STATS
-X, --ctxt=CPU CONTEXT SWITCH
check CPU context switch
-U, --uptime
-p, --pattern
eth0,eth1...sda1,sda2.../usr,/tmp
-w, --warning
warning thresold
-c, --critical
critical thresold
-s, --sleep
default 1 sec.
-u, --unit
%, KB, MB or GB left on disk usage, default : MB
REQS OR BYTES on disk io statistics, default : REQS
-V, --version
version number
ex :
* Cpu usage :
./check_linux_stats.pl -C -w 90 -c 100 -s 5
CPU OK : idle 99.80% | user=0.00% system=0.20% iowait=0.00% idle=99.80%;90;100
* Load average :
./check_linux_stats.pl -L -w 10,8,5 -c 20,18,15
LOAD AVERAGE OK : 0.20,0.07,0.16 | load1=0.20;10;20;0 load5=0.07;8;18;0 load15=0.16;5;15;0
* Memory usage :
./check_linux_stats.pl -M -w 99,50 -c 100,50
MEMORY OK : Mem used=92.57%, Swap used=0.01% |MemUsed=92.57%;95;99 SwapUsed=0.01;50;50 MemCached=12.62 SwapCached=0.00 Active=12.61
* Disk usage :
./check_linux_stats.pl -D -w 10 -c 5 -p /,/usr,/tmp,/var
DISK WARNING used : / 3331.80MB on 3875.09MB (8.86% free) /usr 10084.27MB on 14528.41MB (25.43% free)| /=3331.80MB /usr=10084.27MB
* Disk I/O :
./check_linux_stats.pl -I -w 100,70 -c 150,100 -p sda1,sda2,sda4
DISK I/O OK | sda2_read=0.00;100;150 sda2_write=0.00;70;100 sda4_read=0.00;100;150 sda4_write=0.00;70;100 sda1_read=0.00;100;150 sda1_write=0.00;70;100
* Network usage :
./check_linux_stats.pl -N -w 30000 -c 45000 -p eth0
NET USAGE OK eth0:8021.78KB | eth0_txbyt=3461.39KB eth0_txerrs=0.00KB eth0_rxbyt=4560.40KB eth0_rxerrs=0.00KB
* Open files :
./check_linux_stats.pl -F -w 10000,150000 -c 15000,250000
OPEN FILES OK allocated: 1728 (inodes: 70390) | fhalloc=1728;10000;15000;411810 inalloc=70390;150000;250000;100250 dentries=50754
* Socket usage :
./check_linux_stats.pl -S -w 1000 -c 2000
SOCKET USAGE OK : used 257 |used=257;1000;2000 tcp=18 udp=5 raw=0
* Number of procs :
./check_linux_stats.pl -P -w 1000 -c 2000
PROCS OK : count 272 |count=272;1000;2000 runqueue=2 blocked=0 running=2 new=0.98
* Process mem & cpu :
./check_linux_stats.pl -T -w 2000000000 -c 3000000000 -p /var/run/jonas.pid
PROCESSES OK | java_vsize=1804918784;2000000000;3000000000 java_nswap=0 java_cnswap=0 java_cpu=0
* Paging statistics :
./check_linux_stats.pl -W -w 10,1000,1 -c 20,2000,20 -s 3
Paging OK : in:0.00,out:0.00,flt:0.00 |pgpgin=0.00;10;20;0 pgpgout=0.00;1000;2000;0 pgmajfault=0.00;1;20;0 pswpin=0.00 pswpout=0.00
* Cpu context switch :
./check_linux_stats.pl -X -w 6000 -c 70000 -s 2
CONTEXT SWITCH OK : context 80|ctxt=80
* Uptime :
./check_linux_stats.pl -U -w 9
WARNING : up 0 days, 00:08:16 |uptime=496.05
I have issue with this scripts for memory use in percent. I did not checked about other matter but memory usages showing in very less, but other commands for memroy showing accurate value. as below output.
[root@eam1 libexec]# ./check_linux_stats.pl -M -w 99,50 -c 100,50
MEMORY OK : Mem used: 47.27%, Swap used: 3.18% |MemUsed=47.27%;99;100 SwapUsed=3.18%;50;50 MemCached=52.11% SwapCached=0.98% Active=71.91%
[root@eam1 libexec]# sar -r 1 3
Linux 2.6.18-8.el5 (eam1.cmm.icms.in) 09/23/2014
12:15:11 PM kbmemfree kbmemused %memused kbbuffers kbcached kbswpfree kbswpused %swpused kbswpcad
12:15:12 PM 109176 18371676 99.41 550200 9630152 15866008 520284 3.18 160076
12:15:13 PM 118524 18362328 99.36 550200 9630156 15866008 520284 3.18 160076
12:15:14 PM 118648 18362204 99.36 550200 9630156 15866008 520284 3.18 160076
Average: 115449 18365403 99.38 550200 9630155 15866008 520284 3.18 160076
[root@eam1 libexec]# free -m
total used free shared buffers cached
Mem: 18047 17931 116 0 537 9404
-/+ buffers/cache: 7989 10057
Swap: 16002 508 15494
---------------------
perl script showing 47.27% but sar and nmon and top is showing 98 or 99 percent usage.
Kindly help me for this to get accurate output.
Regards,
Subhash (minixpeg@gmail.com)
Hello,
It's not an issue, but the plugin gets the cache out of the used memory and shows the *real* physical memory usage.
47% MemUsed + 52% MemCached = 99%
Regards,
nice plugins. I found one problem:
Example for checking disk suggest using limits for "disk full":
perl check_linux_stats.pl -D -w 95 -c 100 -u % -p /tmp,/usr,/var
but plugins uses limits for "disk free":
[krizb@kriznb linux]$ df -h /var
Filesystem Size Used Avail Use% Mounted on
/dev/mapper/vg0-varF 4.9G 3.2G 1.5G 69% /var
[krizb@kriznb linux]$ /usr/lib64/nagios/plugins/check_linux_stats.pl -D -w 95 -c 100 -u % -p /var
DISK CRITICAL used : /var 30.47% free | /var=3322124KB
[krizb@kriznb linux]$ /usr/lib64/nagios/plugins/check_linux_stats.pl -D -w 5 -c 0 -u % -p /var
DISK OK used : /var 30.47% free | /var=3322124KB
[krizb@kriznb linux]$
Came across your useful plugin for monitoring Linux Stats. I have downloaded the check_linux perl package and installed it on my remote server. But I’ve issues to run the following plugin. To be honest I’m a newbie into this nagios monitoring server and how to configure it. Appreciate if you could lead me to the correct direction
As far as my concerned my steps is as below
At host/remote server
1. root@server# cd /root/nagios
2. root@server nagios# wget http://exchange.nagios.org/components/com_mtree/attachment.php?link_id=2516&cf_id=24
3. root@server nagios# tar –zxvf Sys-Statistics-Linux-0.66.tar.gz
4. root@server nagios# cd Sys-Statistics-Linux-0.66
5. root@server Sys-Statistics-Linux-0.66# perl Makefile.PL
6. root@server Sys-Statistics-Linux-0.66# make
7. root@server Sys-Statistics-Linux-0.66# make install
8. root@server# vi /usr/local/nagios/etc/nrpe.cfg
and I add the harcoded command argument in the nrpe.cfg
# Check network usage on eth0
command[check_net]=/usr/local/nagios/libexec/check_linux_stats.pl -N -w 1000000 -c 1500000 -p eth0 -s 5
9. restart xinetd service && restart nrpe service
At monitoring server
1. Install theLinux Stats plugin same as above
2. go to cd /usr/local/nagios/etc/service.cfg and add the following:
define service{
use generic-service
host_name fastrocom.com
service_description Network Usage
check_command check_nrpe!check_net
}
3. go to cd /usr/local/nagios/etc/objects/command.cfg and add the following:
# 'check_net_usage' command definition
define command{
command_name check_net
command_line $USER1$/check_net -I $HOSTADDRESS$ $ARG1$
}
I believe I miss a few steps and due to this I’m unable to generate the report at Nagios monitoring System. If I go to /usr/local/nagios/libexec/ there is no linux stats plugin available at that directory
Your guidance and advice is highly appreciated
Nagiosgraph is saying "no data available". Can you tell me how to get this working?
{swapused}/$mem->{swaptotal})*100);
{swapcached}/$mem->{swaptotal})*100);
---
> my $swapused = 0;
> my $swapcached = 0;
> if($mem->{swaptotal}>0) {
> $swapused = sprintf("%.2f", ($mem->{swapused}/$mem->{swaptotal})*100);
> $swapcached = sprintf("%.2f", ($mem->{swapcached}/$mem->{swaptotal})*100);
> }
294c298
=$mem_crit)||($swapused>=$swap_crit)) {
---
> if(($memused>=$mem_crit)||(($swapused>=$swap_crit) && ($swapused>0))) {
297c301
=$mem_warn)||($swapused>=$swap_warn)) {
---
> elsif (($memused>=$mem_warn)||(($swapused>=$swap_warn) && ($swapused>0))) {
Sorry, I do not write English well.
Hello,
issue fixed,
Yes I still maitain my plugin !
Great job this check worked great out of the box, I applied ruddockr suggestion to have CPU usage and not Idle time.
I noticed two small issues :
If you do not have any swap you get the divide by zero error noticed by helium_rday, as a quick fix I added a +1 in the division at line 290 and 291.
I always get a empty disk io, the perfdata are there but the output is always :
DISK OK io : |sda1_read=0.00;100;150 sda1_write=0.00;70;100 with nothing after the "io : ". I'm not a Perl expert but I noticed that the $return_str is initiliazed but no data is added to it.
Hello,
thanks for your comment,
I fixed this two issues on v1.4 !
Are there any pnp4nagios templates for this plugin?
Great plugin.
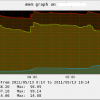
You display a graph with three data sets for memory. While I can create the data using the plugin I do not know how to create the graph.
Could you elaborate how you created the graph, please?
thank you
Jobst
The only problem I'm having is with the check_network_usage check. All the other checks work, but check_network_usage returns "NRPE: Unable to read output". When i run the check on the remote host manually, it gives the correct output, but falls over at some point during the NRPE check when run from the nagios host.
Any ideas?
Please check the calculation of the free memory (physical).
Currently this is the value of memused:
$memused = ($mem->{memused} / $mem->{memtotal}*100);
But you will have to calculate also with the cached memory.
> $memused = sprintf("%.2f", $memused - $memcached);
This is at least the real free memory.
Especially on RedHat based systems almost the whole physical memory will be allocated and only be provided for usage out of the cached memory. Means: once loaded component's required memory stays reserved for the OS for faster re-allocation but it can be freed if the remaining physical memory goes down very fast.
Regards
Jochen
Hello,
I fixed this issue on v1.4,
And for those who couldn't find graphs, graphs are available through nagiosgraph (http://nagiosgraph.sourceforge.net/) which is a small 5-minute setup.
Hi,
You can already check a process using the -T parameter. Example :
./check_linux_stats.pl -T -w 200000000 -c 300000000 -p /var/run/vmtoolsd.pid
Returns virtual mem & cpu information :
PROCESSES OK |vmtoolsd_vsize=39239680;200000000;300000000 vmtoolsd_nswap=0 vmtoolsd_cnswap=0 vmtoolsd_cpu=1
Have an issue thought, the uptime check is returning a status of unknown. Doesn't seem to be effected by the -w -c on the command.
I fixed it,
The plugin can report a notify if the boot time is lower than a given warning threshold in minutes.
./check_linux_stats.pl -U -w 12
WARNING : up 0 days, 00:11:23 |uptime=683
Just one tweak that makes the graph more sensible to read.
default output is %idle which can be 100% all the time if a quiet server.
I changed this to return to CPU busy time (based on cpu_used variable)
code change snippett at line 120-126 (under check_cpu sub):
120 my $perfdata .= "|"
121 ."user=$cpu->{user}% "
122 ."system=$cpu->{system}% "
123 ."iowait=$cpu->{iowait}% "
124 ."InUse=$cpu_used%;$o_warning;$o_critical";
125
126 print "CPU $status : InUse $cpu_used% $perfdata";
Richard
We had an error first when trying to use the plugin. After changing the following lines it worked perfectly:
#use lib "/usr/local/nagios/libexec";
use FindBin;
use lib "$FindBin::Bin";
(replaced the lib definition)
Friendly regards, Till
#Get and scp the files:
wget http://search.cpan.org/CPAN/authors/id/M/MS/MSCHWERN/Test-Simple-0.98.tar.gz
wget http://search.cpan.org/CPAN/authors/id/B/BL/BLOONIX/Sys-Statistics-Linux-0.66.tar.gz
# On the host get makemaker:
yum install perl-ExtUtils-MakeMaker.ppc64 -y
# Install the required modules:
tar xzf Test-Simple-0.98.tar.gz
cd Test-Simple-0.98
perl Makefile.PL
make
make test
make install
cd ..
tar xzf Sys-Statistics-Linux-0.66.tar.gz
cd Sys-Statistics-Linux-0.66
perl Makefile.PL
make
make test
make install
and put in the entries as you described
# command.cfg on nagios server
# $ARG1$ = check_cpu_usage,check_mem_usage,etc..
define command{
command_name check_nrpe
command_line $USER1$/check_nrpe -H $HOSTADDRESS$ -c $ARG1$
}
# nrpe.cfg on the remote server
command[check_cpu_usage]=/usr/local/nagios/libexec/check_linux_stats.pl -C -w 90 -c 100 -s 5
command[check_load_average]=/usr/local/nagios/libexec/check_linux_stats.pl -L -w 10,8,5 -c 20,18,15
command[check_memory_usage]=/usr/local/nagios/libexec/check_linux_stats.pl -M -w 99,50 -c 100,50
command[check_disk_usage]=/usr/local/nagios/libexec/check_linux_stats.pl -D -w 10 -c 5 -p /,/usr,/tmp,/var
command[check_disk_io]=/usr/local/nagios/libexec/check_linux_stats.pl -I -w 100,70 -c 150,100 -p sda1,sda2,sda4
command[check_network_usage]=/usr/local/nagios/libexec/check_linux_stats.pl -N -w 30000 -c 45000 -p eth0
command[check_open_files]=/usr/local/nagios/libexec/check_linux_stats.pl -F -w 10000,150000 -c 15000,250000
command[check_socket_usage]=/usr/local/nagios/libexec/check_linux_stats.pl -S -w 1000 -c 2000
command[check_number_procs]=/usr/local/nagios/libexec/check_linux_stats.pl -P -w 1000 -c 2000
but i get a NRPE: Command 'check_linux_stats.pl' not defined
am i missing something in the host config file hostname.cfg ?
any help welcome thanks :-)
Paul
Also, Sys::Statistics::Linux reports network traffic in "bytes". However you are appending "KB" to the output, but I don't see the conversion in your script. Shouldn't this be appending "B" instead?
When running the memory example however i get the following error:
15:34:18 /usr/local/icinga/libexec $ perl check_linux_stats.pl -M -w 90 -c 95
Illegal division by zero at check_linux_stats.pl line 250.
All the other checks, such as CPU, load, process vmem, network, io, etc work perfectly.
Thoughts?


