
Search Exchange
Search All Sites
Nagios Live Webinars
Let our experts show you how Nagios can help your organization.Login
 New Listings
Directory Tree
Directory
bigbrozer
nagiosgraph Featured
 nagiosgraph parses output and performance data from Nagios plugins, and stores the data in RRD files. nagiosgraph displays data in Nagios trends, as popups for hosts and services, or in separate reports. Easy to set up but eminently customizable.
check_db2_health
 check_db2_health is a plugin which checks the most common metrics of a DB2 database.
$ check_db2_health
Please select a mode
Copyright (c) Gerhard Lausser
Check various parameters of DB2 databases
Usage:
check_db2_health [-v] [-t ] ...
check_db2_health is a plugin which checks the most common metrics of a DB2 database.
$ check_db2_health
Please select a mode
Copyright (c) Gerhard Lausser
Check various parameters of DB2 databases
Usage:
check_db2_health [-v] [-t ] ...
Check WMI Plus
Many, many agentless Windows checks using WMI. No need for any software installs on Windows. Monitor Microsoft Windows systems directly from your Nagios server. Supports user configurable checks using an ini file - create your own WMI Queries. Check W ...
CheckWMI
check_wmi uses the Windows Management Interface to check for common services (cpu, disk, sevices, eventlog...) on Windows machines. It requires the open source wmi client for Linux.
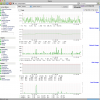
Highcharts for Nagios
 Highcharts for Nagios offering good-looking interactive charts to you.
Zooming can be in the X or Y dimension, or both.
It can show/hide different data series and auto adjust X, Y axis.
You can directly export the chart to PNG, JPG, PDF or SVG format.
Highcharts for Nagios offering good-looking interactive charts to you.
Zooming can be in the X or Y dimension, or both.
It can show/hide different data series and auto adjust X, Y axis.
You can directly export the chart to PNG, JPG, PDF or SVG format.


