Search Exchange
Search All Sites
Nagios Live Webinars
Let our experts show you how Nagios can help your organization.Login
Directory Tree
check_jmx4perl
Current Version
0.92
Last Release Date
2011-05-09
Compatible With
- Nagios 3.x
Owner
Website
Download URL
Hits
133728
Meet The New Nagios Core Services Platform
Built on over 25 years of monitoring experience, the Nagios Core Services Platform provides insightful monitoring dashboards, time-saving monitoring wizards, and unmatched ease of use. Use it for free indefinitely.
Monitoring Made Magically Better
- Nagios Core on Overdrive
- Powerful Monitoring Dashboards
- Time-Saving Configuration Wizards
- Open Source Powered Monitoring On Steroids
- And So Much More!
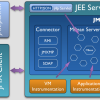
'check_jmx4perl' is a Nagios Plugin for accessing JMX attributes. It uses an agent based approach where the plugin accesses a special servlet deployed on the JEE Server to monitor. This agent (and agents for other platforms) is provided by Jolokia (http://www.jolokia.org)
Benefits of this approach compared to the traditional way of accessing JMX remotely via JSR 160 connectors are:
* No Java installation required on the Nagios host
* Fast plugin startup times because no JVM needs to be launched.
* No special JEE Server startup options required in order to access JMX information remotely
* JSON serialization allows deep access into Java objects
* Firewall friendly communication via HTTP
However, jmx4perl can be operated in a proxy mode where a dedicated proxy server accesses the target platform via JSR-160 JMX remoting. This allows for an agentless operation without the need of installing any extra software on the target server.
Beside this technical advantages, check_jmx4perl provides also a rich feature set:
* Access to JMX attributes and return values of JMX operations for monitoring purposes
* Incremental mode for monitoring the velocity of value changes, e.g. the growth rate of the thread count
* Relative monitoring of values by providing a base value attribute, e.g. for checking that the memory used is below 80% of the available memory
* Deep access to arbitrary Java bean attributes, e.g. the statistics values of a JSR77 Stats object
* Alias names for common attributes and operations
* Selective access to a predefined set of MBeans by providing an access policy file to the agent servlet
This plugin has been tested on a multitude of JEE Servers (JBoss, Oracle Weblogic, IBM Websphere, Glassfish, Tomcat, Jetty and more). It will work on any Servlet Container running on at least Java 1.5.
'check_jmx4perl' is part of a larger distribution, jmx4perl. In addition to this Nagios plugin, jmx4perl contains tools for exploring and examing the available JMX MBeans on the JEE-Server so that it is easy to discover the MBeans and attributes worth monitoring.
Reviews (1)
byPMDubuc, November 14, 2014
I've been using this with Nagios for years. It's very flexible, well maintained (currently at version 1.10), and has good documentation. It works with jolokia on the appserver side so it doesn't require Java on the monitoring servers. Includes a shell and command line utility in addition to the plugin. The developer has done a great job!


 New Listings
