
Search Exchange
Search All Sites
Nagios Live Webinars
Let our experts show you how Nagios can help your organization.Login
 New Listings
Directory Tree
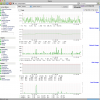
nagiosgraph Featured
Current Version
1.4.4
Last Release Date
2011-01-15
Owner
Website
Download URL
Hits
463459

Meet The New Nagios Core Services Platform
Built on over 25 years of monitoring experience, the Nagios Core Services Platform provides insightful monitoring dashboards, time-saving monitoring wizards, and unmatched ease of use. Use it for free indefinitely.
Monitoring Made Magically Better
- Nagios Core on Overdrive
- Powerful Monitoring Dashboards
- Time-Saving Configuration Wizards
- Open Source Powered Monitoring On Steroids
- And So Much More!
Reviews (9)
byDrexlerAdrian, January 4, 2017
Running without problems on my raspberry pi, now i can have a clean look at my cpu temperature of the past hours.
The only thing is an installation bug on my raspberry. In the file nagiosgraph-apache.conf is a line missing.
It should be:
Options None
AllowOverride None
Order allow,deny
Allow from all
Require all granted
But "Require all granted" is missing.
So if you cant access the nagiosgraph.js, check first this line in your nagiosgraph-apache.conf.
bygr8matt, October 6, 2015
Running Ubuntu 14.04 with Nagios 4.1.1 and runs great! Absolutely great documentation! I installed this via the perl script and everything seems to be working well. Thanks for quality work!
Matt
Matt
byterry, January 21, 2014
I installed and have this running on openSuse and
find it does everything as advertised.
The documentation is excellent, in fact it is one of
the few, sadly, that is complete and carefully
written. I chose the install.pl --layout standalone --prefix /opt/nagiosgraph method of installation; despite not knowing much about Apache.
My congratulations to the developers.
bypankajsain, May 6, 2013
2 of 5 people found this review helpful
When i increase "normal_check_interval" value from default(10min.) to 15min. or greater for any service, nagios stops receiving performance data in .rrd files.
I also checked it with increasing "perfdata_timeout" value but it didn't work.
Nagios version: Nagios Core 3.5.0 or 3.2.3
plugin version: nagios-plugins-1.4.16
Nagiosgraph version: nagiosgraph-1.4.4
OS: Redhat 5.8 64bit
Service configuration:
define service{
use generic-service
host_name Server-10
service_description Disk-Boot Partition Free Space
check_command check_nrpe!check_disk_boot_partition
normal_check_interval 30
}
PS: Services with default "normal_check_interval" value, giving perfdata continually.
Hi expert I need to know if is it possible to install nagiosgraph and nagios on two different server . I like to have nagios on server1 and nagiosgraph on server2 in order to separate the work of the server. If the ansewer is YES , where can I find the install and config information ? Many thank for the help Emilio
Nagiosgraph makes rrd integration with Nagios core easy and seamless. Configuration is relatively simple and it makes trends in your metrics easy to spot. Most checks have rrd integration out of the box however if they do not, you can create custom data grids for them. Flexible and extremely useful.
Works great on centos 5.6 and nagios 3.3.1. Follow the instructions in the README file or their website and you won't have any problems.
I tried installing this on RHEL 6, it didn't recognize the RRD libraries, it didn't recognize my GD libraries. I have now manually compiled both and it still doesn't like it. It looks awesome, if it didn't look so damn cool I never would have started manually compiling everything. Oh yea, I also went through CPAN and tried to get it all through there as well, however, I'm very bad with CPAN so maybe ya'll might have better luck. Also found out after reading all the notes that it hasn't been tested on 3.3.1 but I hadn't even gotten far enough for that to make a difference.


