
Search Exchange
Search All Sites
Nagios Live Webinars
Let our experts show you how Nagios can help your organization.Login
 New Listings
Directory Tree
check_nagiostats
Current Version
20100910
Last Release Date
2012-10-01
Owner
License
GPL
Hits
194697
Files:
| File | Description |
|---|---|
| check_nagiostats.zip | check_nagiostats.zip |

Meet The New Nagios Core Services Platform
Built on over 25 years of monitoring experience, the Nagios Core Services Platform provides insightful monitoring dashboards, time-saving monitoring wizards, and unmatched ease of use. Use it for free indefinitely.
Monitoring Made Magically Better
- Nagios Core on Overdrive
- Powerful Monitoring Dashboards
- Time-Saving Configuration Wizards
- Open Source Powered Monitoring On Steroids
- And So Much More!
"/usr/local/nagios/var/status.dat".
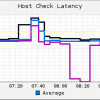
This version runs stable with host and service latency check on my nagios 3.2.2. Anyway, this plugin is far from being finished. Take care and send mail in case of questions.
Version: 20121031
______
ATTENTION: I'm no longer using nagios, therefore I stopped maintaining this plugin. I will take care of detailed bug reports, but cannot test anything.
Anyone using nagios want to take over this plugin? Please contact me by mail (this platform is missing a notification feature...).
_____
This plugin checks nagios performance data by parsing the nagios
status.dat file, which is expected to be located at
"/usr/local/nagios/var/status.dat". Only service check latency and host check
latency are implemented ATM. I plan to do more checks in future,
please send bug reports or feature requests by mail.
options:
-s|--service_latency
-o|--host_latency
-w|--warning
-c|--critical
-f|--file
--hostcount
--servicecount
-h|--help: print help
-v|--verbose: print verbose (testing) output
Examples:
To check host latency: check_nagiostats -o -w 200 -c 500
To check service latency: check_nagiostats -s -w 200 -c 500
Attention: warning and critical always checks max_latency, not
avg or min. Does it make sense to send out alarms based on avg
then on max?
To count checked services: check_nagiostats --servicecount(there is no warning or critical)
To count checked hosts: check_nagiostats --hostcount (there is no warning or critical)
Reviews (3)
bymurilobaliego, March 3, 2017
Hi, thanks for this pluging, as was searching for a pluging as I'm using one Nagios server to monitor other Nagios Servers.
I just changed the subroutine check_s_count() to show warning if any service is warning, same idea to critical services.
sub check_s_count(){
my $line;
my $counter_service_checks=0;
my $counter_warning=0;
my $counter_critical=0;
open (FILE, $file)
or die $!;
$/ = "";
foreach $line(){
if($line=~/servicestatus/){
$counter_service_checks++;
}
if($line=~/plugin_output/){
if($line=~/WARNING/){
$counter_warning++;
}
}
if($line=~/plugin_output/){
if($line=~/CRITICAL/){
$counter_critical++;
}
}
}
close (FILE);
# filling vars for print
$text=("Service Checks: $counter_service_checks - Service Warning: $counter_warning - Service Critial: $counter_critical");
$perfdat=("count=$counter_service_checks");
# this ugly thing is needed to return OK:
$warning=2;
$critical=3;
$value=1;
if($counter_warning>0){
$value=$warning;
}
if($counter_critical>0){
$value=$critical;
}
}
Got to use it straight out of the box.
Keep up the good work.
Keep up the good work.
Owner's reply
Thanks, Jose ;-)


