
Search Exchange
Search All Sites
Nagios Live Webinars
Let our experts show you how Nagios can help your organization.Login
 New Listings
Directory Tree
check_eth
Current Version
1.2
Last Release Date
2016-10-20
Compatible With
- Nagios 1.x
- Nagios 2.x
- Nagios 3.x
- Nagios 4.x
- Nagios XI
Owner
License
GPL
Hits
34528
Files:
| File | Description |
|---|---|
| check_eth | check_eth |

Meet The New Nagios Core Services Platform
Built on over 25 years of monitoring experience, the Nagios Core Services Platform provides insightful monitoring dashboards, time-saving monitoring wizards, and unmatched ease of use. Use it for free indefinitely.
Monitoring Made Magically Better
- Nagios Core on Overdrive
- Powerful Monitoring Dashboards
- Time-Saving Configuration Wizards
- Open Source Powered Monitoring On Steroids
- And So Much More!
Steps: apply this plugin like this
---------------------------------------------------
./check_eth -i eth0 -w 1024K Bps -c 2048K Bps
where i=interface
-w=Warning can be defined in KB,MB etc like (-w 1024K Bps or -w 1M Bps)
-c =Critical can be defined in KB,MB etc like (-c 2048K Bps or -c 2M Bps)
2.also # cd /tmp
# ls -lha | grep traffic
there is file name traffic-eth0 or traffic-eth1 according to your interface
change its permission as per your nrpe user like
chown nagios:nagios traffic-eth0 or if nrpe user is nrpe then chown nrpe:nrpe traffic-eth0 so that nrpe have write permission on it.
Result:after that apply as per in your nrpe.cfg on remote and cheers you will get realtime traffic rate on nagios :)
#./check_eth -i eth0 -w 1024K Bps -c 2048K Bps
Traffic on eth0 : RX Bytes: 1TB, TX Bytes: 3TB: RX Speed: 129KBps, TX Speed: 248KBps: OK bandwidth utilization
#### for commands.cfg if you want to monitor nagios interface traffic
## vim /usr/local/nagios/etc/objects/commands.cfg then add
# 'check_eth' command definition
define command{
command_name check_eth
command_line $USER1$/check_eth -i eth0 -w 1024K Bps -c 2048K Bps
}
### after that in nagios service monitoring file add like this.
define service{
use local-service ; Name of service template to use
host_name NMS
service_description Interface Eth0
check_command check_eth
}
## after adding restart nagios service after verification command.
Thanks
check_eth
Reviews (5)
byGGG, March 17, 2020
Hello,
I have completed all the steps which worked wonderfully.But, i am getting error mentioned in the title
Please Help!!!
(Return code of 127 is out of bounds. Check if plugin exists)
I have completed all the steps which worked wonderfully.But, i am getting error mentioned in the title
Please Help!!!
(Return code of 127 is out of bounds. Check if plugin exists)
byandyspiegl, October 30, 2017
Thanks for the check script.
The only thing I fell for was that the nagios user needs write permissions for the tmpfile. Initially I tried the check script manually which created the tmpfile with owner "root". All following calls of the script failed to write the interface state to the tmpfile (silently!) which led to strange speed values and a very flat PNP curve. :-)
I suggest to add the following lines:
if ( open( TMP, ">$tmpfile-$iface" ) ) {
print( TMP "$data{time}:$data{rxbytes}:$data{txbytes}
" );
close( TMP );
}
+ else
+ {
+ print "ERROR: Unable to write $tmpfile-$iface
";
+ exit $status{UNKNOWN};
+ }
Andy
byrvasten, October 7, 2017
The plugin is real good,
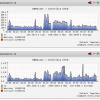
I also like to know how to get the graphs in Nagiosgraph, as for now I only see the alerts
Thanks
I also like to know how to get the graphs in Nagiosgraph, as for now I only see the alerts
Thanks
bysoad1982, July 31, 2017
It's great, I can now have control over the bandwidth my servers are using, I just have one question, how did you get the graphs the screenshots? I only have alerts then but does not show a history with the interface usage.
Thanks!
Thanks!
Exactly what I was looking for! I did have to make a minor adjustment for the script to work. I had to disable using the embedded perl interpreter ("# nagios: -epn" added after the perl statement in the script), but once I did the script returned the result that was expected.
Some further instructions for new comers to Nagios would probably be helpful as well. IE, instructing the user to add it to commands.cfg and their remote servers, etc...
Thanks
Some further instructions for new comers to Nagios would probably be helpful as well. IE, instructing the user to add it to commands.cfg and their remote servers, etc...
Thanks
Owner's reply
Thanks @brianjcollins


