
Search Exchange
Search All Sites
Nagios Live Webinars
Let our experts show you how Nagios can help your organization.Login
 New Listings
Directory Tree
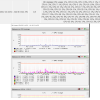
CPU usage for Solaris, Linux and Windows
Current Version
1.0
Last Release Date
2012-10-10
Compatible With
- Nagios 3.x
Owner
License
Other
Hits
70492
Files:
| File | Description |
|---|---|
| check_cpu_usage | The plugin |
| check_cpu_usage.php | Template for pnp4nagios |
| Readme.txt | As it says |


- Works automatically for an unlimited number of CPUs
- Perfomance data can be graphed with pnp4nagios using the template.
- Works automatically for MS Windows, Solaris and Linux servers
By Martin Fuerstenau
Purpose and features of the program:
Author: Martin Fuerstenau, Oce Printing Systems, martin.fuerstenau_at_oce.com
Date written: 14 Apr 2011
Published: 10 Oct 2012
- Get the CPU Usage for Windows, Solaris and Linux servers.
- Works automatically for an unlimited number of CPUs
- Perfomance data can be graphed with pnp4nagios using the template.
- Works for MS Windows, Solaris and Linux servers
- OS will be detected. No need to handle it over.
Sample command definition:
define command{
command_name check_cpu_usage
command_line /usr/lib/nagios/ops_plugins/check_cpu_usage -H $HOSTADDRESS$ -C $ARG1$ -w $ARG2$ -c $ARG3$
}
The syntax:
check_cpu_usage -H|--hostname= [-C |--community=] [-v <1|2c>|--snmpversion=<1|2c>] [-t |--timeout=] [-n|--noperfdata] [-w |--warning=] [-c |--critical=]
or
check_cpu_usage -h|--help
or
check_cpu_usage -V|--version
This plugin check the CPU usage of solaris, linux and windows servers
-h|--help Print detailed help screen
-V|--version Print version information
-H|--hostname= Hostname/IP-Adress to use for the check.
-C|--community= SNMP community that should be used to access the switch.
Default: public
-n|--noperfdata Don't print performance data.
-t|--timeout= Seconds before plugin times out.
Default: 60
-v <1|2c>|--snmpversion=<1|2c> SNMP version details for command-line debugging (can repeat up to 3 times)
Default: 1
-w|--warning= Warning threshold in percent.
Default: 80
-c|--critical= Critical threshold in percent.
Default: 90
Something about the perfdata template.
This template includes a control break. You will always have 4 cpus in on graph with 4 different colors.If you wanna
change it you have to play aorunt with $counter1 and $counter2 in the template.
Author: Martin Fuerstenau, Oce Printing Systems, martin.fuerstenau_at_oce.com
Date written: 14 Apr 2011
Published: 10 Oct 2012
- Get the CPU Usage for Windows, Solaris and Linux servers.
- Works automatically for an unlimited number of CPUs
- Perfomance data can be graphed with pnp4nagios using the template.
- Works for MS Windows, Solaris and Linux servers
- OS will be detected. No need to handle it over.
Sample command definition:
define command{
command_name check_cpu_usage
command_line /usr/lib/nagios/ops_plugins/check_cpu_usage -H $HOSTADDRESS$ -C $ARG1$ -w $ARG2$ -c $ARG3$
}
The syntax:
check_cpu_usage -H
or
check_cpu_usage -h|--help
or
check_cpu_usage -V|--version
This plugin check the CPU usage of solaris, linux and windows servers
-h|--help Print detailed help screen
-V|--version Print version information
-H
-C
Default: public
-n|--noperfdata Don't print performance data.
-t
Default: 60
-v <1|2c>|--snmpversion=<1|2c> SNMP version details for command-line debugging (can repeat up to 3 times)
Default: 1
-w
Default: 80
-c
Default: 90
Something about the perfdata template.
This template includes a control break. You will always have 4 cpus in on graph with 4 different colors.If you wanna
change it you have to play aorunt with $counter1 and $counter2 in the template.
Reviews (2)
bypemcne, August 29, 2013
Pretty good although out of the box I was getting the OID issue above. Simple fix though, insert this on line 141:
$_ =~ s/iso.+ = INTEGER: (d+)/$1/g;
That will parse out the OID data and just leave you with the integer value.
Other than that, it works great. Tested on Windows and Linux no problem.
$_ =~ s/iso.+ = INTEGER: (d+)/$1/g;
That will parse out the OID data and just leave you with the integer value.
Other than that, it works great. Tested on Windows and Linux no problem.
Great plugin except my output is showing OIDs:
OK: Average CPU usage: 0%, CPU-0:iso.3.6.1.2.1.25.3.3.1.2.1 = INTEGER: 5%, CPU-1:iso.3.6.1.2.1.25.3.3.1.2.2 = INTEGER: 9%, CPU-2:iso.3.6.1.2.1.25.3.3.1.2.3 = INTEGER: 1%, CPU-3:iso.3.6.1.2.1.25.3.3.1.2.4 = INTEGER: 1%, CPU-4:iso.3.6.1.2.1.25.3.3.1.2.5 = INTEGER: 3%, CPU-5:iso.3.6.1.2.1.25.3.3.1.2.6 = INTEGER: 1%, CPU-6:iso.3.6.1.2.1.25.3.3.1.2.7 = INTEGER: 0%, CPU-7:iso.3.6.1.2.1.25.3.3.1.2.8 = INTEGER: 1%
How can i fix this?
Owner's reply
I don't know your setup. Feel free to contact me via email.
Martin


