
Search Exchange
Search All Sites
Nagios Live Webinars
Let our experts show you how Nagios can help your organization.Login
 New Listings
Directory Tree
check_snmp_host.sh
Current Version
1.8
Last Release Date
2020-09-25
Compatible With
- Nagios 4.x
Owner
License
GPL
Hits
8417
Files:
| File | Description |
|---|---|
| check_snmp_host.sh | check_snmp_host.sh |
| check_snmp_host_pnp4nagios_templates.zip | check_snmp_host_pnp4nagios_templates.zip |

Meet The New Nagios Core Services Platform
Built on over 25 years of monitoring experience, the Nagios Core Services Platform provides insightful monitoring dashboards, time-saving monitoring wizards, and unmatched ease of use. Use it for free indefinitely.
Monitoring Made Magically Better
- Nagios Core on Overdrive
- Powerful Monitoring Dashboards
- Time-Saving Configuration Wizards
- Open Source Powered Monitoring On Steroids
- And So Much More!
I created pnp4nagios templates for graphs, their usage is completely optional, and you can download them here as well.
Version history
===============
Updates in version 1.8 (2021-03-01)
- Code optimalization throughout the whole plugin.
- Added options to define snmp query timeout in seconds (-T) and number of retries (-R). Defaults are: -T 1 -R 5.
Updates in version 1.7 (2021-02-26)
- Option switch (-o): 'count' option for the proc check. See details in the help.
- The proc check now excludes the processes in 'invalid' status.
- Added the -V flag (volatile) for the proc check which can be used to disable alerts when the process is not found.
- SNMP speed optimalization by using the snmpbulkwalk command if available.
Update in version 1.6 (2021-01-07)
- The 'net' check type now displays interface status, discarded and error packet rate as well.
Update in version 1.5 (2020-11-28)
- Option switch (-o): 'io' option for the net check, usable for network devices where in/out is more reasonable than download/upload.
Updates in version 1.4 (2020-10-10)
- Bugfix for the mem check (pagesize was not calculated in).
- The cpu check now includes the total CPU usage in perfdata, for better graph readability.
- Option switch (-o): 'fallback' option for cpu check, 'bsd' option for mem check. See details in the help.
- The net check type now measures speed (Mbps), not transferred megabytes. It supports alerting too. Due to the changes in the rrd database, upgrading from an earlier version will not show your earlier data anymore. Sorry for the inconvenience.
Updates in version 1.3 (2020-09-25)
- SNMPv3 support
- Fixed a bug in CPU check, and updated its template file (check_snmp_host_cpu.php)
- Minor (cosmetic) change in the load template file (check_snmp_host_load.php)
Update in version 1.2 (2020-03-10)
- Adjustments to variable handling in awk commands
Update in version 1.1 (2020-02-22)
- Bugfix for SNMP read error handling
Version 1.0 (2019-12-22)
- SNMP error detection; check types: cpu, disk, load, mem, net, proc, procs, swap, time, uptime, users
Setup
=====
Important:
To use the graph templates, you have to copy them to the templates folder of your pnp4nagios installation - for example: /usr/share/pnp4nagios/share/templates. The templates are selected by name, meaning the template file name must match the Nagios check name you use in /etc/nagios/objects/commands.cfg. If you called your check as "check_snmp_host_net", then it will try to use the template file called check_snmp_host_net.php.
Because of the stacked graphs, you need to set "RRD_STORAGE_TYPE = MULTIPLE" in process_perfdata.cfg.
Checks
======
The current version is capable running the following checks:
- cpu: CPU load percentage. Use the provided template to get a stacked graph in pnp4nagios. The stacked graph will show user, system, kernel, nice and wait times with different colors. On multi-processor systems this will display the average load of all processors. If you add the '-o fallback' switch, it will use a fallback method to read CPU statistics (less data). Use this if the default method does not work, or shows wrong data.
- disk: Disk usage in percentage. Use the -m flag to specify the mountpoint. The root partition is, for example: -m /
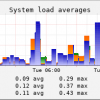
- load: System load averages for 1 minute, 5 minutes and 15 minutes. The provided pnp4nagios template will combine the three data into a single graph. Warning and critical thresholds should contain values for each of them, separated by commas. For example: -w 5,4,3 -c 9,8,7
- mem: Memory usage (percentage). Use the provided template to get a stacked graph in pnp4nagios. The stacked graph will show used, buffer and cache memory with different colors. Alerting will happen when the real usage (used memory) will reach a threshold. If you add the '-o bsd' switch, it will calculate memory usage for a BSD system.
- net: Network speed. Graphs are in megabits per second (Mbps). Use the -n flag to specify the network interface you want to monitor. You can define the upload and download speeds as well. Use numbers only. If undefined, the NIC speed will be used. Warning and critical thresholds are a percentage of the speed. If left empty, there will be no alerts. Example (20 Mbps upload speed, 100 Mbps download speed, warning 85%, critical 95%): -U 20 -D 100 -w 85 -c 95. Use the provided template to get a combined (in/out) traffic graph in pnp4nagios. Perfdata is displayed as Download (in) and upload (out) by default. If you are monitorint a network device (like a router), you can use the io option (-o io) to display traffic as in/out (download=in, upload=out). Attention: this changes the rrd database names!
- proc: Detailed information of a process. Use the -p flag to specify the process name, for example: -p httpd. Use the '-V' flag if the process is volatile (we should not trigger a warning if there is no such process). Otherwise, you will get a critical alert if the number of running instances is 0 (zero). If the process cannot be found by name (exact match), it will look into its parameters too (exact match again). If you want a loose search, you can put '.*' before, after, or both sides of your search string. For example, it will find 'httpd' if you search for 'http.*', '.*ttpd', or '.*ttp.*'. You will get CPU and memory usage graphs, and can set warning/critical levels for the memory usage (in MB). If you add the '-o count' switch, it will only report the number of instances this process has, and it will run faster on large systems. You can set warning and critical alerts based on this number. 0 will always give you a critical alert.
- procs: The total number of currently running processes.
- swap: Swap space usage (percentage).
- time: Timedrift compared to the Nagios server system time. Warning and critical levels are in seconds. Use only absolute numbers (for example, 5 instead of -5).
- uptime: System uptime. This is just for information display, do not set -w or -c.
- users: The number of active user sessions.
If you have requests/issues, please post them here.
===============
Updates in version 1.8 (2021-03-01)
- Code optimalization throughout the whole plugin.
- Added options to define snmp query timeout in seconds (-T) and number of retries (-R). Defaults are: -T 1 -R 5.
Updates in version 1.7 (2021-02-26)
- Option switch (-o): 'count' option for the proc check. See details in the help.
- The proc check now excludes the processes in 'invalid' status.
- Added the -V flag (volatile) for the proc check which can be used to disable alerts when the process is not found.
- SNMP speed optimalization by using the snmpbulkwalk command if available.
Update in version 1.6 (2021-01-07)
- The 'net' check type now displays interface status, discarded and error packet rate as well.
Update in version 1.5 (2020-11-28)
- Option switch (-o): 'io' option for the net check, usable for network devices where in/out is more reasonable than download/upload.
Updates in version 1.4 (2020-10-10)
- Bugfix for the mem check (pagesize was not calculated in).
- The cpu check now includes the total CPU usage in perfdata, for better graph readability.
- Option switch (-o): 'fallback' option for cpu check, 'bsd' option for mem check. See details in the help.
- The net check type now measures speed (Mbps), not transferred megabytes. It supports alerting too. Due to the changes in the rrd database, upgrading from an earlier version will not show your earlier data anymore. Sorry for the inconvenience.
Updates in version 1.3 (2020-09-25)
- SNMPv3 support
- Fixed a bug in CPU check, and updated its template file (check_snmp_host_cpu.php)
- Minor (cosmetic) change in the load template file (check_snmp_host_load.php)
Update in version 1.2 (2020-03-10)
- Adjustments to variable handling in awk commands
Update in version 1.1 (2020-02-22)
- Bugfix for SNMP read error handling
Version 1.0 (2019-12-22)
- SNMP error detection; check types: cpu, disk, load, mem, net, proc, procs, swap, time, uptime, users
Setup
=====
Important:
To use the graph templates, you have to copy them to the templates folder of your pnp4nagios installation - for example: /usr/share/pnp4nagios/share/templates. The templates are selected by name, meaning the template file name must match the Nagios check name you use in /etc/nagios/objects/commands.cfg. If you called your check as "check_snmp_host_net", then it will try to use the template file called check_snmp_host_net.php.
Because of the stacked graphs, you need to set "RRD_STORAGE_TYPE = MULTIPLE" in process_perfdata.cfg.
Checks
======
The current version is capable running the following checks:
- cpu: CPU load percentage. Use the provided template to get a stacked graph in pnp4nagios. The stacked graph will show user, system, kernel, nice and wait times with different colors. On multi-processor systems this will display the average load of all processors. If you add the '-o fallback' switch, it will use a fallback method to read CPU statistics (less data). Use this if the default method does not work, or shows wrong data.
- disk: Disk usage in percentage. Use the -m flag to specify the mountpoint. The root partition is, for example: -m /
- load: System load averages for 1 minute, 5 minutes and 15 minutes. The provided pnp4nagios template will combine the three data into a single graph. Warning and critical thresholds should contain values for each of them, separated by commas. For example: -w 5,4,3 -c 9,8,7
- mem: Memory usage (percentage). Use the provided template to get a stacked graph in pnp4nagios. The stacked graph will show used, buffer and cache memory with different colors. Alerting will happen when the real usage (used memory) will reach a threshold. If you add the '-o bsd' switch, it will calculate memory usage for a BSD system.
- net: Network speed. Graphs are in megabits per second (Mbps). Use the -n flag to specify the network interface you want to monitor. You can define the upload and download speeds as well. Use numbers only. If undefined, the NIC speed will be used. Warning and critical thresholds are a percentage of the speed. If left empty, there will be no alerts. Example (20 Mbps upload speed, 100 Mbps download speed, warning 85%, critical 95%): -U 20 -D 100 -w 85 -c 95. Use the provided template to get a combined (in/out) traffic graph in pnp4nagios. Perfdata is displayed as Download (in) and upload (out) by default. If you are monitorint a network device (like a router), you can use the io option (-o io) to display traffic as in/out (download=in, upload=out). Attention: this changes the rrd database names!
- proc: Detailed information of a process. Use the -p flag to specify the process name, for example: -p httpd. Use the '-V' flag if the process is volatile (we should not trigger a warning if there is no such process). Otherwise, you will get a critical alert if the number of running instances is 0 (zero). If the process cannot be found by name (exact match), it will look into its parameters too (exact match again). If you want a loose search, you can put '.*' before, after, or both sides of your search string. For example, it will find 'httpd' if you search for 'http.*', '.*ttpd', or '.*ttp.*'. You will get CPU and memory usage graphs, and can set warning/critical levels for the memory usage (in MB). If you add the '-o count' switch, it will only report the number of instances this process has, and it will run faster on large systems. You can set warning and critical alerts based on this number. 0 will always give you a critical alert.
- procs: The total number of currently running processes.
- swap: Swap space usage (percentage).
- time: Timedrift compared to the Nagios server system time. Warning and critical levels are in seconds. Use only absolute numbers (for example, 5 instead of -5).
- uptime: System uptime. This is just for information display, do not set -w or -c.
- users: The number of active user sessions.
If you have requests/issues, please post them here.
Reviews (1)
byDvazquez2020, January 22, 2020
The plugins works greats but i have a problem to populate the graphics, can you help me, I create the command definitions and create a check_command definition in PNP4Nagios but dont populate the graphics.
Owner's reply
Sorry for the late reply, I forgot to check this page.
If you have problems with your pnp4nagios setup, this is a great help: https://docs.pnp4nagios.org/pnp-0.6/start
If pnp4nagios actually works, but my plugin does not show graphs, it is important to know that you need to set "RRD_STORAGE_TYPE = MULTIPLE" in process_perfdata.cfg. I forgot to mention this in my original post.


