
Search Exchange
Search All Sites
Nagios Live Webinars
Let our experts show you how Nagios can help your organization.Login
 New Listings
Directory Tree
Directory
fsoaress76
byfsoaress76, September 2, 2013
1 of 1 people found this review helpful
/etc/nagios3/conf.d/pops.cgi
define host{
use generic-host
host_name INTERNET
alias LINK INTERNET
address 200.147.67.142
parents localhost
icon_image cook/wan_cloud.png
icon_image_alt
vrml_image cook/wan_cloud.png
statusmap_image cook/wan_cloud.png
contact_groups admins
notes latlng:-5.145640,-38.098219
register 1
}
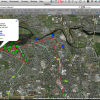
/nagmap/config.php
//in linux run `updatedb` and `locate nagios.cfg` and `locate status.dat` to find these files
$nagios_cfg_file = "/etc/nagios3/conf.d/nagios.cfg";
$nagios_status_dat_file = "/var/cache/nagios3/status.dat";
//set to the centre of your map
$nagmap_map_centre = '-5.1488,-38.097';
/var/cache/nagios3/status.dat
hoststatus {
host_name=INTERNET
modified_attributes=0
check_command=check-host-alive
check_period=
notification_period=24x7
check_interval=5.000000
retry_interval=1.000000
event_handler=
has_been_checked=1
should_be_scheduled=1
check_execution_time=0.079
check_latency=0.143
check_type=0
current_state=0
last_hard_state=0
last_event_id=29348
current_event_id=29607
current_problem_id=0
last_problem_id=9709
plugin_output=PING OK - Packet loss = 0%, RTA = 48.63 ms
long_plugin_output=
performance_data=rta=48.632000ms;5000.000000;5000.000000;0.000000 pl=0%;100;100;0
last_check=1378131866
next_check=1378132176
check_options=0
current_attempt=1
max_attempts=10
state_type=1
last_state_change=1377726653
last_hard_state_change=1377726653
last_time_up=1378131876
last_time_down=1377718163
last_time_unreachable=0
last_notification=1377726653
next_notification=0
no_more_notifications=0
current_notification_number=0
current_notification_id=29136
notifications_enabled=1
problem_has_been_acknowledged=0
acknowledgement_type=0
active_checks_enabled=1
passive_checks_enabled=1
event_handler_enabled=1
flap_detection_enabled=1
failure_prediction_enabled=1
process_performance_data=1
obsess_over_host=1
last_update=1378132066
is_flapping=0
percent_state_change=0.00
scheduled_downtime_depth=0
}


