Search Exchange
Search All Sites
Nagios Live Webinars
Let our experts show you how Nagios can help your organization.Login
Directory Tree
check_iftraffic64
- Nagios 1.x
- Nagios 2.x
- Nagios 3.x
- Nagios 4.x
- Nagios XI
| File | Description |
|---|---|
| check_iftraffic64.pl | Check plugin |
| check_net_status.php | PNP4Nagios template. |
Check_iftraffic64 is an updated version of (check_iftraffic3) and has been changed to use 64 bit SNMP counters but can still handle 32 bit. Some math issues found in check_iftraffic3 were resolved as well.
Version .77: There are no functionality changes with this release. I simply fixed some code comments (spelling errors, removed spurious comments, etc.)
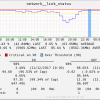
I also uploaded a PNP4Nagios template for the plugin. It provides the following features. Put this file in the /usr/local/pnp4nagios/share/templates/ directory. See uploaded examples.
1. It converts the performance data from the Nagios plugin standard (Bytes) to bits, however, the graph is percent based, bits are listed in the text of the legend not on the graph itself.
2. Peak - Prints the timestamp of when your peak traffic during the graph period happened.
3. Rem Peak Cap - Calculates remaining capacity or headroom (how much bandwidth is left between your peak traffic and your critical threshold).
4. Rem Ave Cap - Calculates remaining capacity or headroom (how much bandwidth is left between your average traffic and your critical threshold).
5. Total Bytes - Displays the total amount of data that has crossed the interface during the graphed period.
6. Min over Thresh - Displays how much time during the graphed period traffic was above the critical threshold.
7. Times over Thresh - Counts and displays how many times the critical threshold was crossed during the graphed period.
Version .76: Thanks to Mark Rittinghaus for pointing out and recommending solutions to a couple of bugs in the perfdata. These have been addressed in this release. This release changes the units for the in_ave/out_ave perfdata from bits (if you specify bits on the command line) to Bytes and changes inAbsolut/outAbsolut from Bytes to Continuous. Both of these changes may disrupt your perfdata graphing if you use PNP4Nagios (RRD). It does not affect the in_ave_pct/out_ave_pct perfdata output.
Version .75:
Thanks to Philip Ho
Version .74:
Thanks to the help of Rogerio Tomassoni de Araujo Junior we now have SNMPv3 support! The check can use three v3 levels (NoauthNoPriv, authNoPriv, and authpriv). You can also specify the Auth method (MD5 or SHA) and or the encryption method (DES, AES, or 3DES). Thanks Rogerio!
Version .73:
Fixed a couple of bugs, they are listed in the comments at the top of the script.
Version .7:
The check script now has an 64|32 bit auto detection, you can also force 64 or 32 bit on the cmd line. Added logic to handle invalid interface speed results (thanks Mathieu GRZYBEK).
Version .6:
I've removed text from the output that was not necessary. Thanks Nicholas Coulin for pointing it out.
Version .5:
Significant features in this check include the following:
1. Capable of handling 32 and 64 (default) bit SNMP counters
2. Auto detects max bandwidth (unless specified)
3. Supports asymetric links, i.e. Ability to specify different BW limits (in and out) other than what is automatically detected. Good for Internet connections that have different up and down speeds
4. NagVis weathermap line compatible perfdata output
5. Returns CRITICAL status when the interface is down.
examples:
# Simple 64 bit check of interface used as the primary host interface (based on IP address of host1)
check_iftraffic64.pl -H host1 -C sneaky
# 32 bit mode check of interface index 5 in bits/s with 100m bandwidth limit
check_iftraffic64.pl -H host1 -C sneaky -i 5 -B -b 100 -u m --32bit
# Check of interface using address 192.168.1.1 in bits/s running 50m down (in) and 10m up (out)
check_iftraffic64.pl -H host1 -C sneaky -A 192.168.1.1 -B -I 50 -O 10 -u m
Forked and updated version:
https://github.com/Tylan/check_iftraffic64
is it possible to have an alert if the traffic is equal to 0 or if it is lower than 10 for example
thanks
Now I am looking at SNMP v3 support. I see that it only has partial support for SNMP v3 in that it does not support Context Names.
I am looking to monitor CheckPoint VSX firewalls and to monitor individual VS (Virtual Systems) it requires SNMP v3 and for the Context Name of the VS to be supplied.
I've looked at the code and I cannot yet figure out how to add Context Name support to it.
First of all thanks for this amazing plugin. It really helps me a lot.
However, I have one problem with the units used by the plugin.
I use this especially for Nagvis.
In the host list, and on the host view all works perfectly but in nagvis, on my weatherline, the unit is always in Bytes.
I tried options (-u) and also to modify the plugin config but no way to get those units in megabits or gigabits for example...
Can someone help me about that ?
Thanks again for sharing this plugin!
have a problem here with this script and snmpd service 5.7.3 on Ubuntu18.04
We ask for traffic on remote host on eth0 by:
check_iftraffic64.pl -H 10.100.4.193 -i eth0
Result is:CRITICAL: Could not match eth0
Reason is line "my $resp=$response->{$key};" in sub fetch_ifdescr
On a working machine $resp contains lo, eth0, eth1
On invalid machine with new snmpd this contains also interface/controllerinformation, so script does not find the eth0 match.
###
my $resp=$response->{$key};
$resp =~ s/x00//;
print "resp: $resp
";
###
This is response from snmpd on Ubuntu18.04
resp: Intel Corporation Ethernet Controller 10-Gigabit X540-AT2
resp: Intel Corporation 82574L Gigabit Network Connection
resp: Intel Corporation Ethernet Controller 10-Gigabit X540-AT2
resp: Intel Corporation 82574L Gigabit Network Connection
resp: lo
So i have some assumptions:
- this Script losts some of values of response, unfortunately iam not a perl-programmer
- snmpd on machine is buggy
- snmpd on machine has wrong configuration. (We use minimized /etc/snmp/snmpd.conf with content "rocommunity public 10.100.4.206" successful on many systems)
What do you mean? Is there something know to this case?
Thanks,
Hans
On executing above command from CLI on server i'm getting output as
"CRITICAL - OUT bandwidth (109.13%) too high|inUsage=32.14%;80;90 outUsage=109.13%;80;90 inBandwidth=602577.37B outBandwidth=2046264.78B inAbsolut=736506469220c outAbsolut=382869632218c"
BUt on web interface it is showing output as "(No output on stdout) stderr:"
I use check_iftraffic64 with centreon 3.4. snmpV3 I had a problem. I had a response from the plugins, the check after i had no output fromthe plugins, the check after my response is ok. it's the same if i do it from the shell. could you help me or give me some advice to solve my problem thanks a lot
I tested this plugin and it did not work correctly out of the box on the command line because it did output nothing at all (but web ui said "OK"). Looking into the code the problem was on line 140 where it says
my $TRAFFIC_FILE = "/usr/local/nagios/libexec/traffic/";
This directory did not exist on my system; this caused the plugin to output nothing. After adding this directory, it worked. Maybe add a test if directory exists and throw an error if not?
I miss two features though, whose availability would easily push this plugin to a five star plugin(!)
- error packet counter and corresponding warn/crit tresholds
- automatic port speed detection
These two are very important IMHO:
- error counter
If the error counters grows, you could be alarmed; thanks to performance data, you would even have some long time trending, being able to research when errors increased e.g.
- auto-detect port speed
If the network admin decides to change a port speed from 100M to 1G, the plugin settings for this specific port will become incorrect. Auto-detection could help here.
If you start the plugin with debug level 4 you can see that port speed detection _would_ already work. The command
/usr/lib/nagios/plugins/check_iftraffic64.pl -H 192.168.123.123 -C not-so-public -i 1 --debug 4
outputs (shortend):
OID's:
IfOperStatus: 1.3.6.1.2.1.2.2.1.8.1
IfSpeed: 1.3.6.1.2.1.31.1.1.1.15.1
IfSpeed32: 1.3.6.1.2.1.2.2.1.5.1
RESULTS:
Operational Status: 1
Interface Speed (64bit): 100 Mbits
Interface Speed (32bit): 100000000 bits
So there is already a port speed detection, but not used in any way - maybe it is unreliable?
Since I cannot re-review a plugin here, I will mark it with 5 stars, hoping the author might add these two features in the future.
It's because the tmp plugin path has changed since.
I solved the problem, by making sure the temp directory exist & have right (or just change it in the script ;))
Thanks for the author !
Can you add the possibility to have the output with only one unit ?
Actually, the result can be in B KB MB GB
For PNP4Nagios we need measure with always the same unit
Thanks
Hi GeoHolz,
Yes, the fix was just posted in version .75. Thanks for pointing out the deficiency.
-greg
On full interface saturation the traffic is shown around 200% of the interface. I am downloading a testfile with ~5Mb, but the check reports ~10Mb.
Its a 50/10MBit wan-interface and this is my check:
check_iftraffic64.pl # -H 192.168.123.123 -C public -i "Adaptive Security Appliance 'outside' interface" -I 50 -O 10 -u m
Hi Unic,
If you are specifying bandwidth limits with the -I and -O switches then the plugin is going to use those parameters in calculations. In that case if your getting more than 100% throughput the only thing I can think of is that the circuit is faster that listed.
Hi,
I am not sure of all cases that would cause this. There are a few I am aware of though.
1. We had a NAS device that returned the 32 bit counter value for both 32 bit and 64 bit SNMP queries. This took us a while to figure and we were surprised to see them doing this. This will give you the types of results you are seeing, though I imaging (and hope) that this is a rare situation.
2. Another case is when two instances of Nagios are writing to the temp file for an interface messing with the calculations of the other check.
There may be other causes but these are the two that come to mind. You can try the latest version of the plugin there may be something else that was fixed there that would address this as well.
./check_iftraffic64.pl -H 192.168.16.254 -C public -i wan2 -b 20 -u m
CRITICAL - IN bandwidth (35711048.32%) too high|inUsage=35711048.32%;85;98 outUsage=69084009.66%;85;98 inBandwidth=892.78GB outBandwidth=1727.10GB inAbsolut=4463881040328B outAbsolut=8635501207011B
Do you know why ?
Thx a lot
Hi ogirard,
If you add '--force' to your check command it should resolve your issue. See the ALERT section of the check description for an explanation of the issue.
cheers,
-greg
/check_iftraffic64.pl -H DEVICE_IP -C COMMUNITY -i GigabitEthernet0/48 -I 1000 -O 1000 -u g -w 85 -c 95
Thanks!!
this plugin works very well, but i am getting this error on few devices periodically.
Traffic_gi0/2;CRITICAL;SOFT;1;CRITICAL - IN bandwidth (81985529197.52%) too high
Hi notic,
Use the '--force' switch in your command. See the ALERT section of the description above for details.
-greg


 New Listings


