
Search Exchange
Search All Sites
Nagios Live Webinars
Let our experts show you how Nagios can help your organization.Login
 New Listings
Directory Tree
check_mysqld
Current Version
0.94
Last Release Date
2012-03-31
Compatible With
- Nagios 2.x
- Nagios 3.x
- Nagios XI
- Nagios Fusion
Owner
Website
License
GPL
Hits
168423
Files:
| File | Description |
|---|---|
| check_mysqld.pl | check_mysqld.pl (version 0.94 - Mar 31, 2012) - beta, please report problems |
| check_mysqld.ncfg | Full nagiosgrapher template with 11 pages, requires nagios 3.0 or nagios2 compiled with larger performance buffers. |
| check_mysqld.pl | chec_mysqld.pl (version 0.91 - Dec 20, 2011) |
| check_mysqld_queries.ncfg | Smaller nagiosgrapher template for first 2 pages only |
| check_mysqld.php | check_mysqld.php - pnp4nagios template for use with check_mysqld.pl (template version 0.31 - Mar 20, 2012) |
| check_mysqld.cfg | check_mysqld.cfg - for pnp4nagios configuration that treats all data values as COUNTER |


This MYSQL check plugin does "SHOW STATUS" command on mysql server and can issue alerts if selected variables are above/below given number(s). It also returns all variables as performance data for further nagios 2.0 post-processing.
The variables you can use include but are not limited to:
* Threads_running
* Threads_connected
* Threads_cached
* Open_tables
* Open_files
* Innodb_row_lock_current_waits
* Qcache_free_memory
* Qcache_total_blocks
* Delayed_errors
* Delayed_writes
* Key_blocks_not_flushed
* Slave_running
* Slow_launch_threads
* Slow_queries
You can check more then one (as many as needed) variables at same time. Full list of variables you can use is at: http://dev.mysql.com/doc/refman/5.0/en/server-status-variables.htm
Version 0.8 has been posted in December 2007 that fixes previous limitations and allows to fully specify both upper and lower thresholds in nagios plugin specification compatible way. Additional enhancements are:
1. When you have Mysql 5.0.2 or above the plugin will issue 'SHOW GLOBAL STATUS' instead of 'SHOW STATUS'
2. Instead of plugin doing 'SHOW STATUS' you can now specify custom SQL query (some other SHOW command or SELECT with two columns of data in the output) and set conditions and attribute checks using data.
3.Version 09 now supports nagios plugin specification for specifying threshold (start:end and @start:end) in addition to my custom format (>,<,=,!).
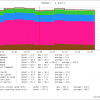
Graphing template has also now been posted. Here is what first page looks like (there are 11 pages in larger template): http:/william.leibzon.org/nagios/mysql_1hours.png
SETUP NOTES
1. Make sure to check and if necessary adjust the the path to utils.pm
2. Make sure to install perl DBI and mysql DBD modules
It is recommended you use arguments to pass on all options to this plugin, but if necessary you can change default MySQL hostname, port, user, password variables at the start of the script code
Sample command and service definitions:
define command{
command_name check_mysqld
command_line $USER1$/check_mysqld.pl -H $HOSTADDRESS$ -u $ARG1$ -p $ARG2$
}
define service {
use service-critical
hostgroup_name mysql
service_description MYSQLD
check_command check_mysqld!foo!apples
}
Examples of command-line use:
/usr/lib/nagios/plugins/check_mysqld.pl -p foo -f -u nagios -a uptime,threads_connected,questions,slow_queries,open_tables -A threads_running,innodb_row_lock_time_avg -w ",,,," -c ",,,,>25" -H nagios -v
The variables you can use include but are not limited to:
* Threads_running
* Threads_connected
* Threads_cached
* Open_tables
* Open_files
* Innodb_row_lock_current_waits
* Qcache_free_memory
* Qcache_total_blocks
* Delayed_errors
* Delayed_writes
* Key_blocks_not_flushed
* Slave_running
* Slow_launch_threads
* Slow_queries
You can check more then one (as many as needed) variables at same time. Full list of variables you can use is at: http://dev.mysql.com/doc/refman/5.0/en/server-status-variables.htm
Version 0.8 has been posted in December 2007 that fixes previous limitations and allows to fully specify both upper and lower thresholds in nagios plugin specification compatible way. Additional enhancements are:
1. When you have Mysql 5.0.2 or above the plugin will issue 'SHOW GLOBAL STATUS' instead of 'SHOW STATUS'
2. Instead of plugin doing 'SHOW STATUS' you can now specify custom SQL query (some other SHOW command or SELECT with two columns of data in the output) and set conditions and attribute checks using data.
3.Version 09 now supports nagios plugin specification for specifying threshold (start:end and @start:end) in addition to my custom format (>,<,=,!).
Graphing template has also now been posted. Here is what first page looks like (there are 11 pages in larger template): http:/william.leibzon.org/nagios/mysql_1hours.png
SETUP NOTES
1. Make sure to check and if necessary adjust the the path to utils.pm
2. Make sure to install perl DBI and mysql DBD modules
It is recommended you use arguments to pass on all options to this plugin, but if necessary you can change default MySQL hostname, port, user, password variables at the start of the script code
Sample command and service definitions:
define command{
command_name check_mysqld
command_line $USER1$/check_mysqld.pl -H $HOSTADDRESS$ -u $ARG1$ -p $ARG2$
}
define service {
use service-critical
hostgroup_name mysql
service_description MYSQLD
check_command check_mysqld!foo!apples
}
Examples of command-line use:
/usr/lib/nagios/plugins/check_mysqld.pl -p foo -f -u nagios -a uptime,threads_connected,questions,slow_queries,open_tables -A threads_running,innodb_row_lock_time_avg -w ",,,," -c ",,,,>25" -H nagios -v
Reviews (2)
byadameros, February 13, 2020
The alerting seems rock solid, but I can not get the graphing working with the check_mysqld.php file as provided. I keep getting Undefined offset errors instead of graphs.
What am I doing wrong?
What am I doing wrong?
bylevilovelock, May 7, 2012
Another great plugins thanks.
Just a hint, for ubuntu make sure you have done:
sudo apt-get install libdbi-perl lidbd-mysql-perl
Just a hint, for ubuntu make sure you have done:
sudo apt-get install libdbi-perl lidbd-mysql-perl


